Bitcoin Price Analysis: Is $54K Inevitable for BTC if $60K Support Is Decisively Lost?After yielding to heavy selling pressure and losing several key support levels over the past few weeks, Bitcoin is now holding at a key support level. The broader market structure continues to favor the sellers, but the market’s reaction to the $60k critical demand zone could determine the next major move.
Bitcoin Price Analysis: The Daily Chart
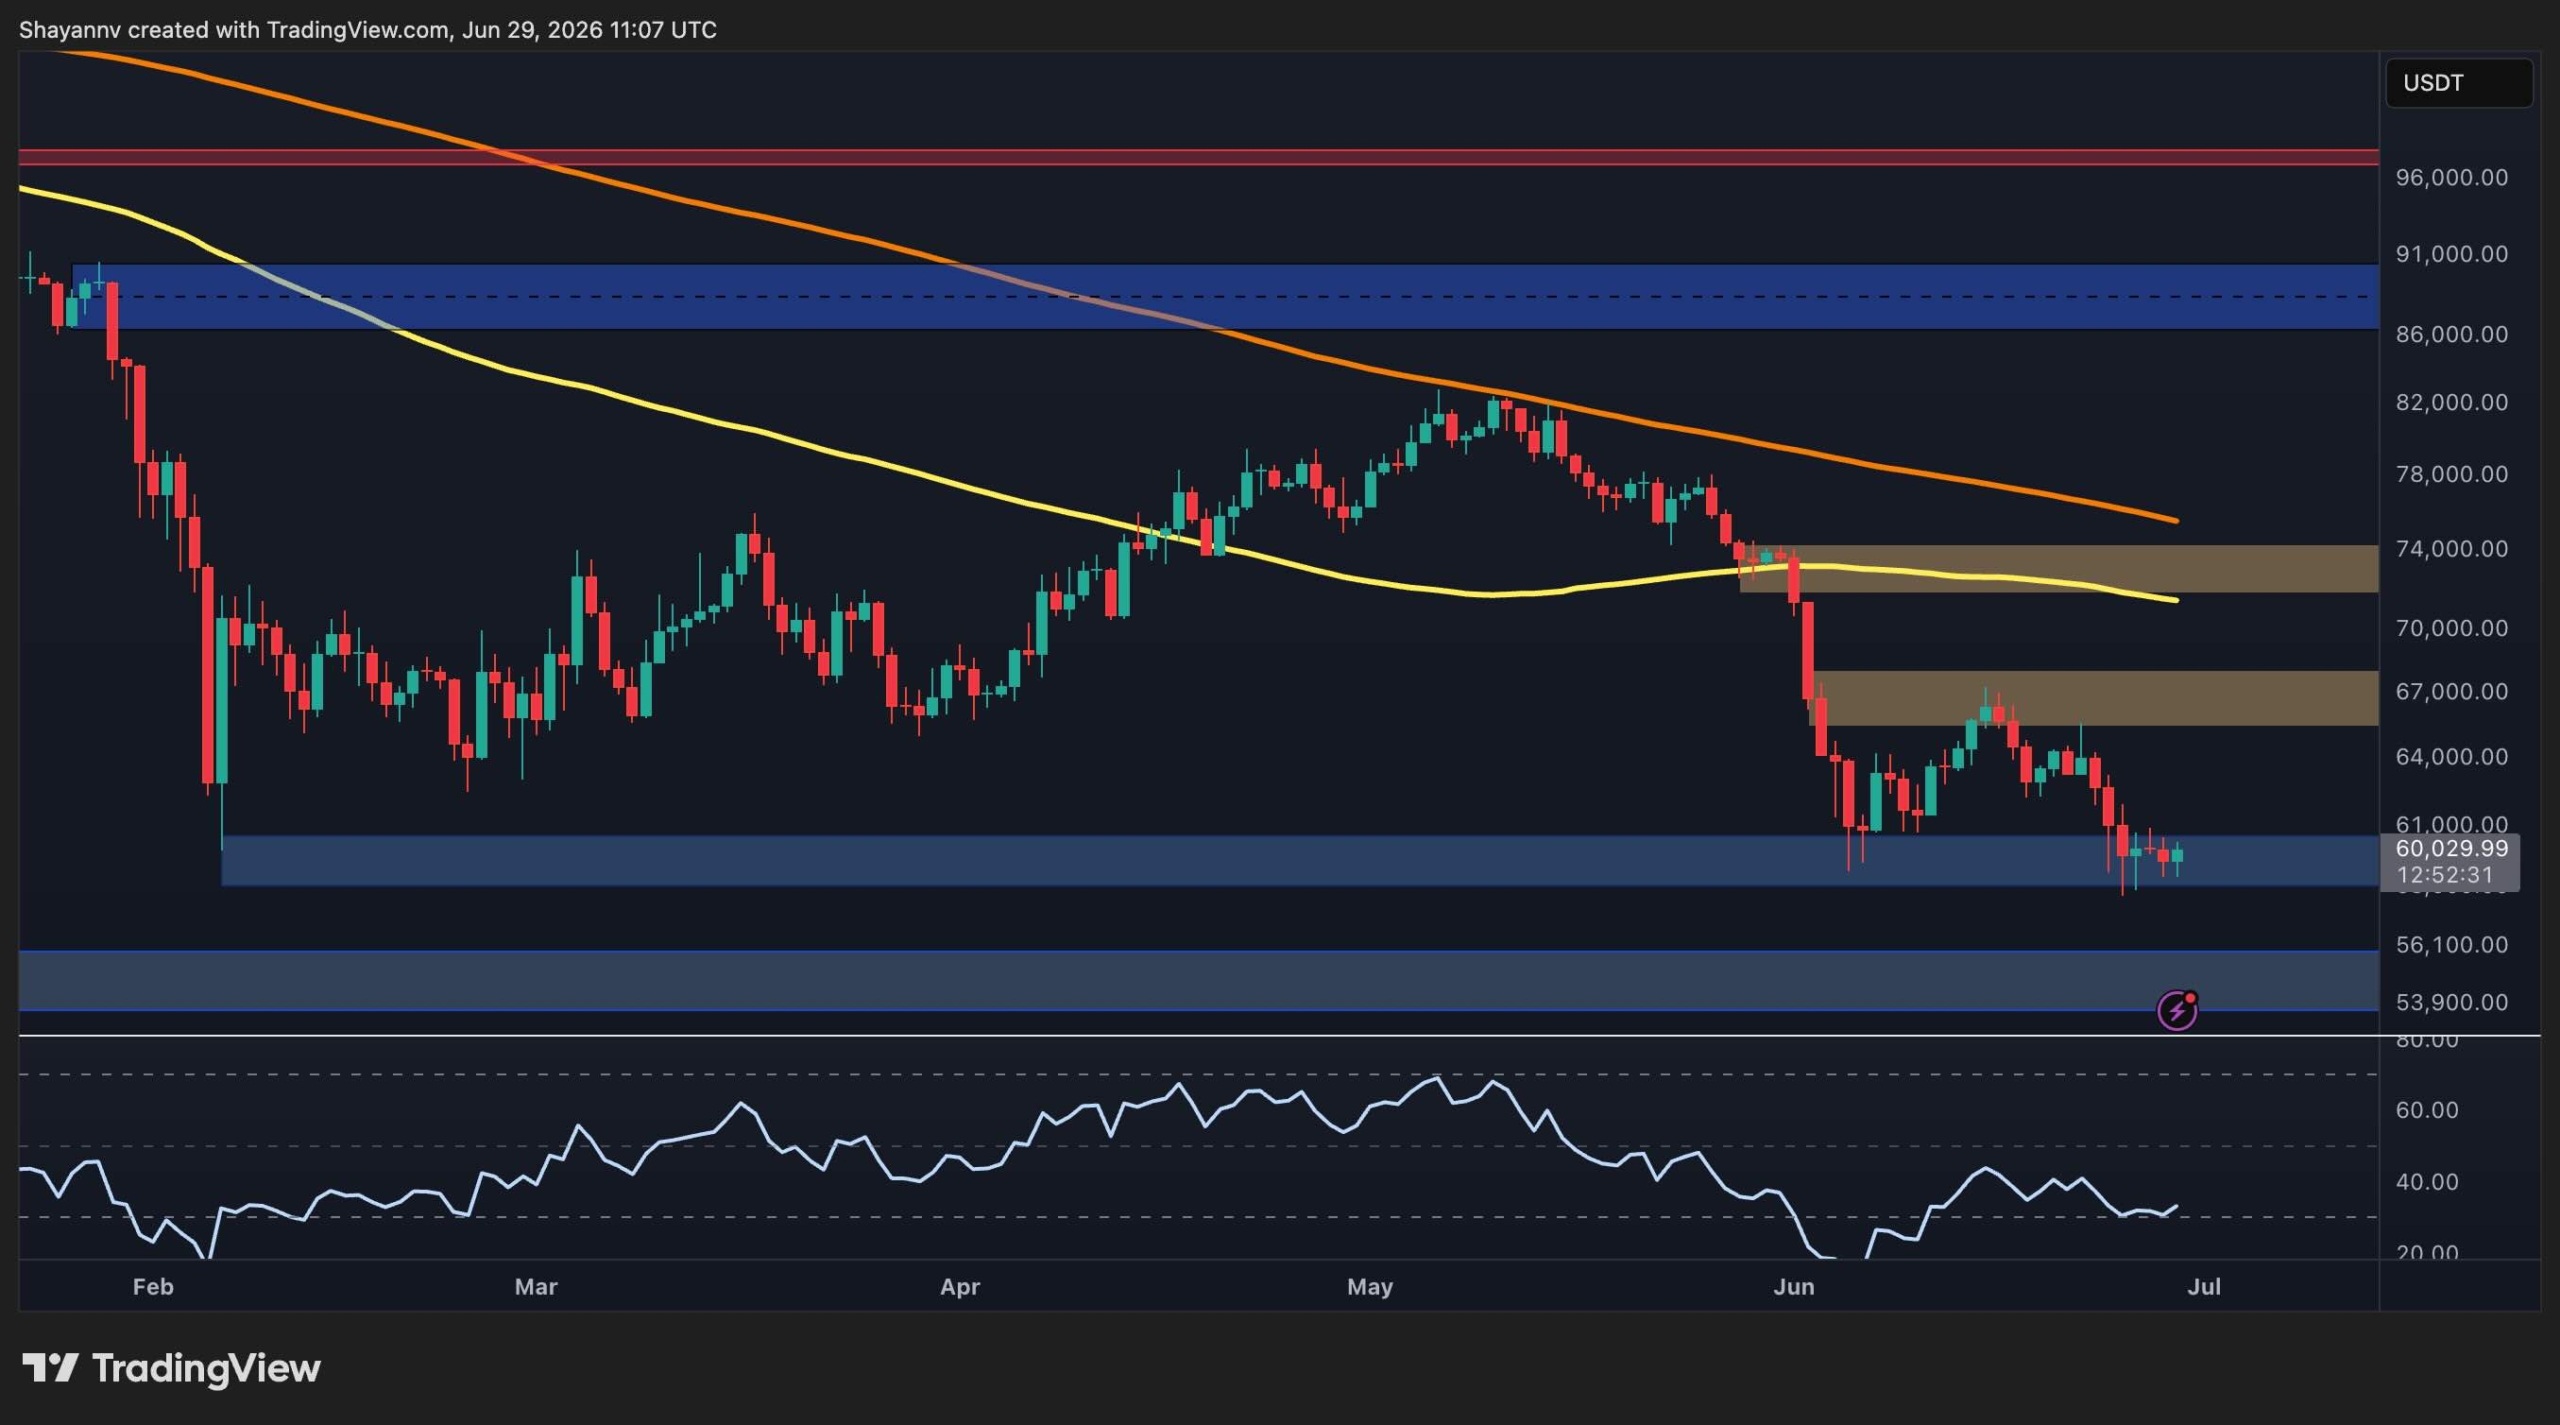
On the daily timeframe, BTC is trading below $60K after extending its decline from the rejection near the $82K region. The breakdown below the $74K resistance area, which also aligns with the 100-day moving average, confirmed a bearish shift in market structure and accelerated the latest leg lower.
The asset is currently testing a major support zone around $60K, where buyers have managed to slow the decline. This area also served as an important demand region earlier in the year and helped prevent the massive February crash, making it a key level to watch. As long as Bitcoin holds above this range, the market could attempt a relief rally.
However, the broader trend remains bearish. The 100-day and 200-day moving averages are both sloping downward, with the 200-day MA positioned around the $75k area and continuing to act as the ultimate dynamic resistance. Meanwhile, the $67K zone represents the first significant resistance on any recovery attempt, followed by the stronger $74K supply region.
To the downside, a decisive daily close below the $60K support would likely expose the next major demand area around $54K and potentially extend the current corrective phase.
BTC/USDT 4-Hour Chart
The 4-hour chart highlights a well-defined descending trendline that has consistently capped every recovery attempt since late May. The price recently tested this trendline again but failed to break above it, reinforcing bearish control over the short-term structure.
BTC is now consolidating just above the horizontal support around $60K, forming a relatively tight trading range after the latest rejection. The RSI has also recovered from oversold conditions and is hovering near the midline, suggesting that downside momentum has cooled, although there is still no convincing bullish momentum shift.
The first hurdle for buyers remains the descending trendline, which is currently located just below the $61K to $62K resistance zone. A successful breakout above both levels could trigger a short-term recovery toward the $67K supply area.
On the other hand, losing the $60K support with a bearish candle closing below it would invalidate the current consolidation and likely accelerate selling toward the next daily demand zone near $54K.

On-Chain Analysis
The Exchange Whale Ratio, which measures the proportion of the top exchange inflows relative to total inflows, has been trending lower alongside Bitcoin’s recent decline. Lower readings generally indicate that large holders are contributing a smaller share of exchange deposits, suggesting that aggressive whale selling has eased compared to previous periods.
While this moderation in whale activity may reduce immediate sell-side pressure, it does not yet signal a confirmed bullish reversal. Bitcoin continues to trade at a major technical support while the broader market structure remains bearish, indicating that buyers still need to reclaim key resistance levels before a sustained recovery becomes more likely.
For now, the combination of stabilizing whale inflows and price holding above the $60K support zone offers the first signs that selling pressure may be cooling. Nevertheless, confirmation will require Bitcoin to break above the descending trendline on the 4-hour timeframe and reclaim the $67K area before sentiment can begin shifting in favor of the bulls.

The post appeared first on CryptoPotato.
read the full story
After yielding to heavy selling pressure and losing several key support levels over the past few weeks, Bitcoin is now holding at a key support level. The broader market structure continues to favor the sellers, but the market’s reaction to the $60k critical demand zone could determine the next major move.
Bitcoin Price Analysis: The Daily Chart
On the daily timeframe, BTC is trading below $60K after extending its decline from the rejection near the $82K region. The breakdown below the $74K resistance area, which also aligns with the 100-day moving average, confirmed a bearish shift in market structure and accelerated the latest leg lower.
The asset is currently testing a major support zone around $60K, where buyers have managed to slow the decline. This area also served as an important demand region earlier in the year and helped prevent the massive February crash, making it a key level to watch. As long as Bitcoin holds above this range, the market could attempt a relief rally.
However, the broader trend remains bearish. The 100-day and 200-day moving averages are both sloping downward, with the 200-day MA positioned around the $75k area and continuing to act as the ultimate dynamic resistance. Meanwhile, the $67K zone represents the first significant resistance on any recovery attempt, followed by the stronger $74K supply region.
To the downside, a decisive daily close below the $60K support would likely expose the next major demand area around $54K and potentially extend the current corrective phase.
BTC/USDT 4-Hour Chart
The 4-hour chart highlights a well-defined descending trendline that has consistently capped every recovery attempt since late May. The price recently tested this trendline again but failed to break above it, reinforcing bearish control over the short-term structure.
BTC is now consolidating just above the horizontal support around $60K, forming a relatively tight trading range after the latest rejection. The RSI has also recovered from oversold conditions and is hovering near the midline, suggesting that downside momentum has cooled, although there is still no convincing bullish momentum shift.
The first hurdle for buyers remains the descending trendline, which is currently located just below the $61K to $62K resistance zone. A successful breakout above both levels could trigger a short-term recovery toward the $67K supply area.
On the other hand, losing the $60K support with a bearish candle closing below it would invalidate the current consolidation and likely accelerate selling toward the next daily demand zone near $54K.
On-Chain Analysis
The Exchange Whale Ratio, which measures the proportion of the top exchange inflows relative to total inflows, has been trending lower alongside Bitcoin’s recent decline. Lower readings generally indicate that large holders are contributing a smaller share of exchange deposits, suggesting that aggressive whale selling has eased compared to previous periods.
While this moderation in whale activity may reduce immediate sell-side pressure, it does not yet signal a confirmed bullish reversal. Bitcoin continues to trade at a major technical support while the broader market structure remains bearish, indicating that buyers still need to reclaim key resistance levels before a sustained recovery becomes more likely.
For now, the combination of stabilizing whale inflows and price holding above the $60K support zone offers the first signs that selling pressure may be cooling. Nevertheless, confirmation will require Bitcoin to break above the descending trendline on the 4-hour timeframe and reclaim the $67K area before sentiment can begin shifting in favor of the bulls.
The post appeared first on CryptoPotato.
read the full storyBitcoin’s $60K breakdown sets up a volatility shock as traders load up on downside hedges
Bitcoin’s break below the $60,000 area has pushed digital asset markets into a more defensive…
HYPE ETFs Pull in $111 Million as Bitcoin and Ether Funds Lose Over $2 Billion
The crypto exchange-traded fund (ETF) market entered the final week of June with one foot on the…
Strategy Snaps 9-Day Losing Streak as Bitcoin Giant Adopts 'Robust' Capital Framework
Strategy's shares remained 42% down from its market-rattling Bitcoin sale nearly a month ago.
Bitcoin price prediction: Has BTC bottomed at $60K, or is $55K next?
Bitcoin has fallen to around $60,000, more than half off its all-time high, with the Fear and Greed…
Bitcoin put-call ratio hits 1-year high: Are bears preparing for drop to $55K?
Rising demand for put options and persistent ETF outflows highlight Bitcoin's weakness despite lower…

Schiff Warns Bitcoin Drop Could Trigger Strategy “Death Spiral”
TL;DR: Strategy authorized a Bitcoin monetization program of up to $3.25 billion earmarked for USD…
CryptoQuant Flags Rising Bitcoin Whale Share On Gate As BTC Holds Below $60,000
CryptoQuant said Gate.io's Bitcoin whale share tripled to 16% while BTC traded below $60,000 during…

Bitcoin Is in a Fight at $60K—Here's What the Charts Say
BTC kissed $58,800 and bounced. The daily chart is deep in bear territory, and prediction markets…
Bitcoin lending is entering a new institutional era, according to Silicon Valley Bank
The bank said bitcoin lending has emerged from the 2022 crypto credit collapse with stronger risk…
Bitcoin balances $60K tightrope as US stocks rebound on fresh Iran peace deal hopes
Bitcoin faced its own battle for support as US stocks headed higher and analysts warned of a lack of…
MSTR jumps after Strategy says it may sell more Bitcoin to fund dividends and buybacks
Strategy (formerly MicroStrategy) shares rose Monday after the Bitcoin holder moved to reassure…
Institutions Cut Bitcoin And Ethereum ETF Exposure But Keep Buying XRP And HYPE
Institutional investors reportedly reduced Bitcoin and Ethereum ETF exposure while XRP and HYPE…
What Is Strategy (MSTR)? The Bitcoin Treasury Company
Software firm Strategy (formerly MicroStrategy) and its co-founder Michael Saylor have become…
Strategy Could Sell $3.25 Billion in Bitcoin Under New Plan, Peter Schiff Warns
Strategy’s potential bitcoin sales have raised concerns among market watchers after Peter Schiff…
XRP ETF Inflows Extend To Eight Weeks As Bitcoin Funds Bleed
XRP ETF inflows reportedly extended to an eight-week streak while Bitcoin ETFs continued to record…
Spot Bitcoin ETFs Reportedly See $4.06 Billion Monthly Outflows As Institutions Cut Exposure
US spot Bitcoin ETFs reportedly recorded $4.06 billion in monthly outflows as institutional…
BlackRock’s IBIT Reportedly Surpasses Fidelity In Bitcoin ETF Assets
BlackRock's iShares Bitcoin Trust reportedly surpassed Fidelity in assets under management,…
Strategy Could Sell Up To $1.25 Billion In Bitcoin Under New Capital Framework
Strategy approved a digital credit capital framework that could allow up to $1.25 billion in Bitcoin…