Bitcoin Price Prediction: What Is BTC’s Most Likely Scenario This Week?Bitcoin continues to trade under heavy pressure after losing several key support levels in quick succession. The recent breakdown has pushed the asset into a significant demand region around $60K, while on-chain data suggests older coins are increasingly moving to exchanges, adding another layer of caution for market participants.
Bitcoin Price Analysis: The Daily Chart
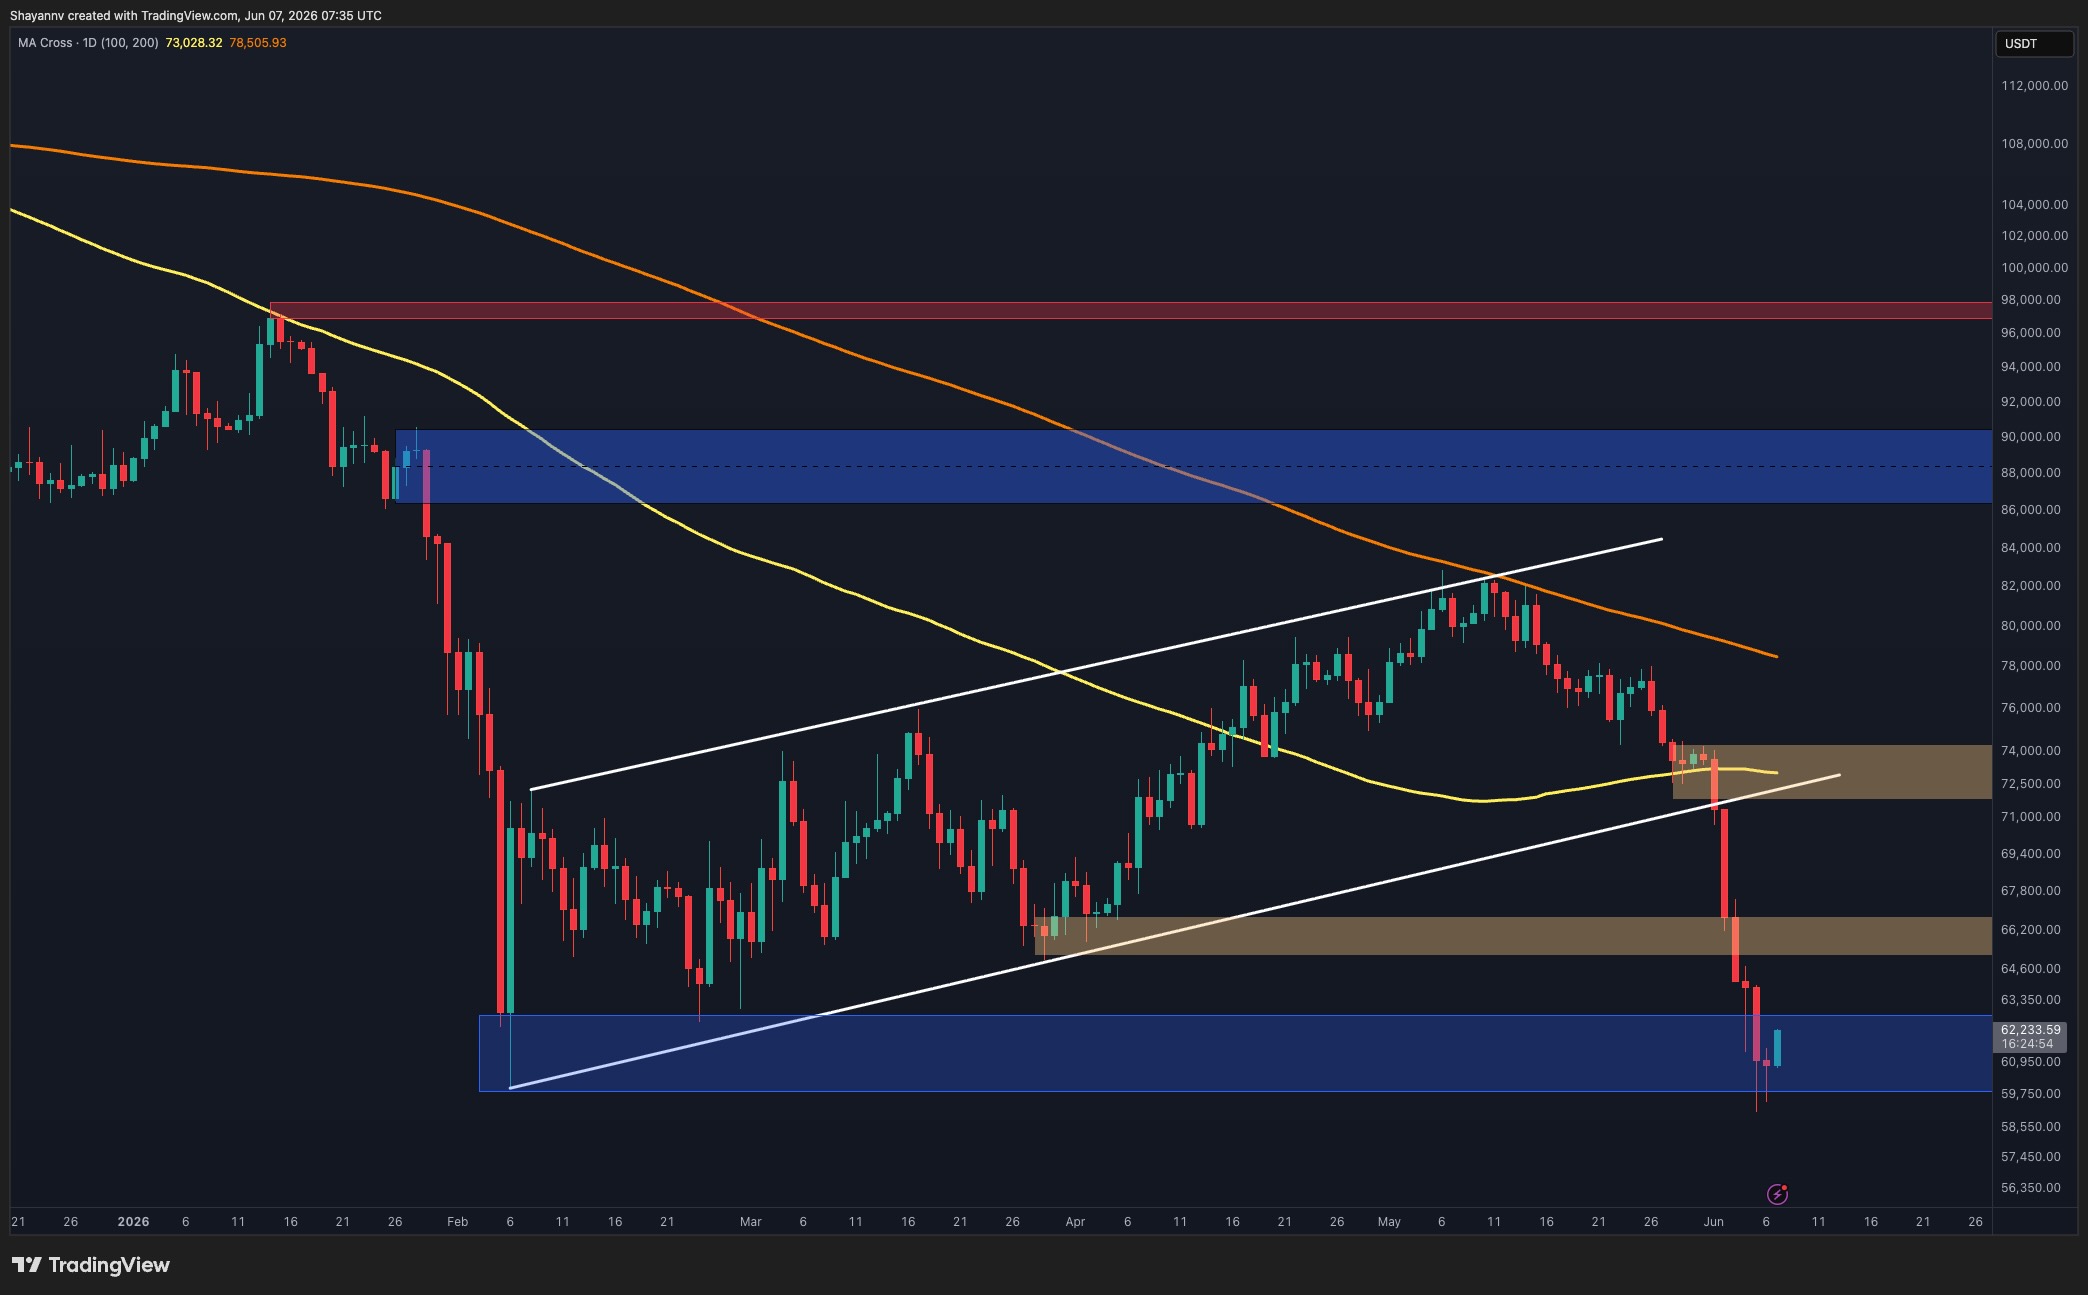
On the daily timeframe, BTC’s recent breakdown was followed by an aggressive selloff that pushed the price toward a major support zone between approximately $59K and $62K. This area previously acted as a strong accumulation region and is currently providing the first meaningful reaction from buyers. The latest candles show a modest bounce from the lows around $59.1K, but the recovery remains limited so far.
The broader structure remains bearish as long as Bitcoin trades below the former support area around $66K to $67K. Any recovery rally is likely to encounter resistance there first. Above that, the next major supply zone sits around $72K to $74K, which coincides with the breakdown region and could attract renewed selling pressure.
A sustained hold above $60K could allow for a relief rally, but reclaiming the $66K to $74K range would be necessary to improve the larger market structure. Failure to defend the current demand zone could expose Bitcoin to a deeper correction below the recent lows.
BTC/USDT 4-Hour Chart
The 4-hour chart provides a clearer view of the recent breakdown. Following the rejection, the price lost the key $72K to $74K supply area before breaking below the intermediate support around $65K. The selloff accelerated afterward, creating a sharp, impulsive move toward the blue demand zone near $60K.
For now, buyers are attempting to stabilize the market within this support region. However, the recent rebound appears corrective rather than impulsive. As long as Bitcoin remains below the broken support at $65K and beneath the former consolidation zone around $72K to $74K, the short-term trend favors the bears.
A recovery above $65K would be the first sign that downside momentum is weakening. Until then, traders will likely monitor the current support closely for either a stronger reversal or another leg lower.

Onchain Analysis
The Exchange Inflow Spent Output Age Bands chart reveals a noticeable increase in exchange deposits from older coins, particularly the 3-6 month and 6-12 month cohorts. Recent spikes are among the largest visible on the chart and have appeared while Bitcoin has been trending lower.
Historically, elevated exchange inflows from older holders can indicate growing distribution activity, as coins that have remained dormant for several months are moved back to exchanges where they can potentially be sold. While a single spike does not guarantee further downside, repeated inflow surges during a declining market often reflect weakening holder conviction.
The latest data suggests that medium-term holders have become increasingly active during the recent correction. If these inflows persist, they could continue to generate supply pressure and make a sustained recovery more difficult in the near term.
Overall, Bitcoin is attempting to defend a critical support zone around $60K to $62K. While a short-term bounce is underway, both market structure and on-chain activity suggest that bulls still face significant work before a broader trend reversal can be confirmed.

The post appeared first on CryptoPotato.
read the full story
Bitcoin continues to trade under heavy pressure after losing several key support levels in quick succession. The recent breakdown has pushed the asset into a significant demand region around $60K, while on-chain data suggests older coins are increasingly moving to exchanges, adding another layer of caution for market participants.
Bitcoin Price Analysis: The Daily Chart
On the daily timeframe, BTC’s recent breakdown was followed by an aggressive selloff that pushed the price toward a major support zone between approximately $59K and $62K. This area previously acted as a strong accumulation region and is currently providing the first meaningful reaction from buyers. The latest candles show a modest bounce from the lows around $59.1K, but the recovery remains limited so far.
The broader structure remains bearish as long as Bitcoin trades below the former support area around $66K to $67K. Any recovery rally is likely to encounter resistance there first. Above that, the next major supply zone sits around $72K to $74K, which coincides with the breakdown region and could attract renewed selling pressure.
A sustained hold above $60K could allow for a relief rally, but reclaiming the $66K to $74K range would be necessary to improve the larger market structure. Failure to defend the current demand zone could expose Bitcoin to a deeper correction below the recent lows.
BTC/USDT 4-Hour Chart
The 4-hour chart provides a clearer view of the recent breakdown. Following the rejection, the price lost the key $72K to $74K supply area before breaking below the intermediate support around $65K. The selloff accelerated afterward, creating a sharp, impulsive move toward the blue demand zone near $60K.
For now, buyers are attempting to stabilize the market within this support region. However, the recent rebound appears corrective rather than impulsive. As long as Bitcoin remains below the broken support at $65K and beneath the former consolidation zone around $72K to $74K, the short-term trend favors the bears.
A recovery above $65K would be the first sign that downside momentum is weakening. Until then, traders will likely monitor the current support closely for either a stronger reversal or another leg lower.
Onchain Analysis
The Exchange Inflow Spent Output Age Bands chart reveals a noticeable increase in exchange deposits from older coins, particularly the 3-6 month and 6-12 month cohorts. Recent spikes are among the largest visible on the chart and have appeared while Bitcoin has been trending lower.
Historically, elevated exchange inflows from older holders can indicate growing distribution activity, as coins that have remained dormant for several months are moved back to exchanges where they can potentially be sold. While a single spike does not guarantee further downside, repeated inflow surges during a declining market often reflect weakening holder conviction.
The latest data suggests that medium-term holders have become increasingly active during the recent correction. If these inflows persist, they could continue to generate supply pressure and make a sustained recovery more difficult in the near term.
Overall, Bitcoin is attempting to defend a critical support zone around $60K to $62K. While a short-term bounce is underway, both market structure and on-chain activity suggest that bulls still face significant work before a broader trend reversal can be confirmed.
The post appeared first on CryptoPotato.
read the full storyA $239B claim on dormant Bitcoin wallets faces a new obstacle after old address moves
A June 5 court stay and a June 2 spend turned the Noah Doe case into a test of legal title versus…
Bitcoin Is Bleeding, And This Is What Is Driving The BTC Price Crash
The BTC price is declining more each day as the bear market tightens its grip on the crypto market.…
Bitcoin Bear Case Builds: Analyst Targets $46,000 After Channel Break
Bitcoin clawed back above $59,000 last week. But don’t get too comfortable. Crypto analyst…
Bitcoin ETFs Lose $1.72B in Second-Largest Weekly Outflow Since Launch
Crypto ETF flows stayed under pressure from June 1 to June 5, with bitcoin funds posting a fourth…
CME Opens the Door to Bitcoin Volatility Trading With First Futures Bets Placed
TL;DR: CME’s bitcoin volatility index futures began trading last week, with Monarq Asset…
Strategy Buys 1,550 BTC for $101M One Week After Selling 32, Cash Reserve Hits $1B
Strategy purchased 1,550 bitcoin for $101.3 million between June 1 and 7, one week after its first…

Strategy’s latest Bitcoin purchase eases fears sparked by 32 BTC sale
The company’s latest Bitcoin purchase appears to calm fears that its earlier 32 BTC sale signaled…
Why Dave Portnoy Is Begging Michael Saylor to Buy More Bitcoin
Dave Portnoy urges Michael Saylor and MicroStrategy to keep buying Bitcoin as he suffers…

Strive Expands Bitcoin Holdings to 19,032 BTC with $2.1 Million Purchase
Strive, Inc. (Nasdaq: ASST) acquired 32 bitcoins between June 2 and June 7, 2026. The average price…
Bitcoin price $60K support not yet safe as more macro headwinds stack up
Bitcoin analysis warned that $60,000 may not hold next, as bear-market moves continued and macro…

How Much Bitcoin Does MicroStrategy Own?
Very few companies have become as closely associated with Bitcoin as MicroStrategy, now known as…
Bitcoin braces for inflation shock as CPI puts bulls on edge
Bitcoin traders are preparing for a series of U.S. inflation reports this week that could determine…
Peter Schiff Says Strategy Is Forcing Shareholders to Accept Negative Bitcoin Yield After Latest 1,550 BTC Buy
Prominent gold advocate and Bitcoin critic Peter Schiff has renewed his criticism of Strategy and…
Spot Bitcoin ETFs bleed $1.7B as outflow streak hits four weeks
BlackRock’s IBIT accounted for most of the weekly Bitcoin ETF redemptions, while Fidelity and…
Michael Saylor Boosts Bitcoin Reserve With $101 Million BTC Purchase
Michael Saylor’s Strategy has spent $101 million buying Bitcoin’s dip despite suffering about…
Blame bitcoin's tumble on rising inflation, not Strategy, 10xResearch argues
The main driver behind bitcoin's weakness was ETF selling after red-hot April U.S. inflation data,…