Bitcoin just slipped below the bear-market line traders cannot ignoreBitcoin's move below the 200-week moving-average area has turned a familiar cycle marker into a live demand test.
On Sunday, June 28, BTC traded at $60,238, down 6.1% over the past 7 days and 18% over the past 30 days. That left the spot below the 200-week weighted moving average, tracked by Newhedge at $62,383, after three heavy ETF redemption sessions.
The line now separates two near-term outcomes. A move back through the low-$62,000 area would suggest forced selling and ETF redemptions temporarily pushed Bitcoin through a level long-term holders watch. More time below it would turn the old stress marker into potential overhead resistance.
The market's focus on the level is visible in other 200-week moving-average dashboards and in social posts that framed the break as a cycle warning. A moving average can organize the test. Flow and time below the line supply the answer.
The Bitcoin price repair level is close
The 200-week weighted average is important because it compresses years of price behavior into a single slow-moving reference. Bitcoin has historically spent limited time below it during severe drawdowns, which is why traders treat it as a cycle-level stress marker.
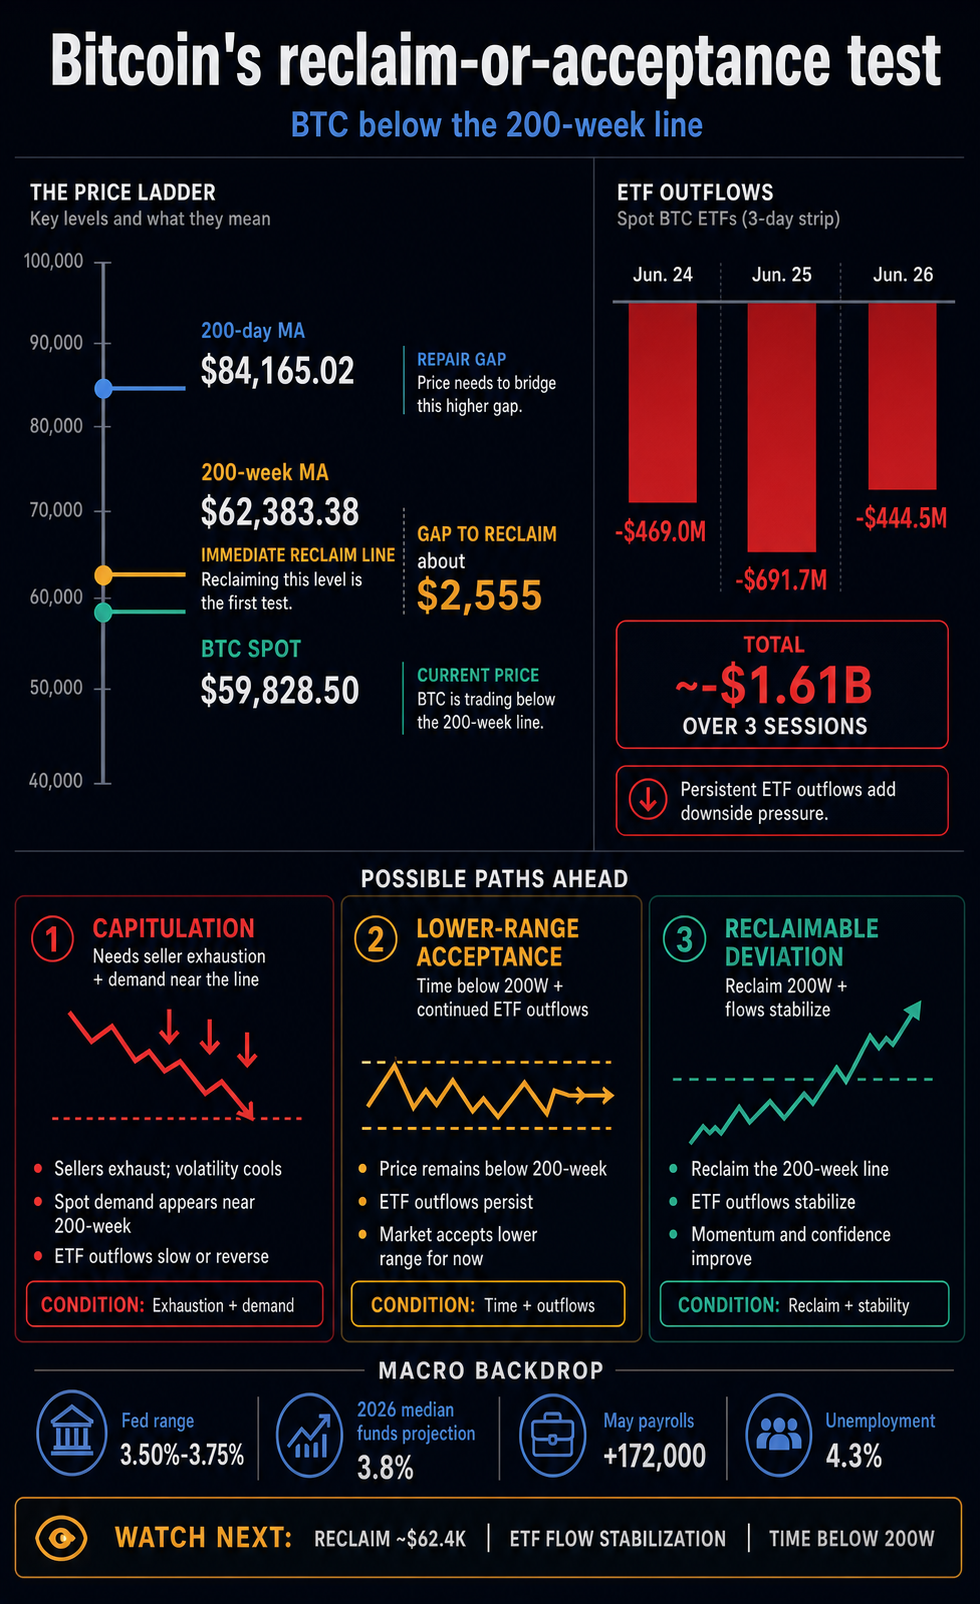
In this setup, the gap is concrete. Bitcoin sits roughly $2,555 below Newhedge's 200-week weighted moving average. That is close enough for volatility to challenge quickly, yet large enough that hovering near $60,000 leaves the break unresolved.
The 200-day marker is part of a larger repair sequence. Barchart's technical screen showed Bitcoin's 200-day simple moving average at $84,165, far above spot. A 200-week reclaim here would test whether the breakdown is accepted; a 200-day reclaim would signal broader trend repair.
That sequence keeps the signal clean. Bitcoin can recover the 200-week line and remain in a damaged trend, while repeated failures below the 200-week area would keep pressure on the idea that the move is only a liquidation event.
ETF redemptions turned the line into a flow test
The flow backdrop makes the current move harder to dismiss as a pure chart event. Farside Investors' Bitcoin ETF table showed net outflows of $469 million on Jun. 24, $691 million on Jun. 25, and $444 million on Jun. 26.
Together, those sessions represented about $1.61 billion in net redemptions. They show that the break arrived while one of the main institutional demand channels was removing support.
Capitulation would require evidence that sellers are exhausting themselves and that buyers are absorbing supply near the level. Continued ETF redemptions would run counter to this, making a reclaim harder to sustain.
Recent CryptoSlate coverage has already addressed the near-term setup, including the $58,000 weekend exhaustion-versus-acceptance question, the ETF outflow and inflation backdrop, and liquidation pressure around the failed $60,000 rebound.
The fresh issue is whether selling pressure has pushed Bitcoin through a line that longer-cycle traders will defend, or whether the same flows make that line less relevant until demand improves.
Macro conditions add outside pressure. In its Jun. 17 statement, the Federal Reserve held its target range at 3.50% to 3.75% and said inflation remained elevated.
The Fed's June projection materials showed a median 2026 funds rate of 3.8%, while the May employment report showed payrolls rising by 172,000 and unemployment at 4.3%.
A resilient labor market and sticky inflation backdrop can keep rate-cut expectations from becoming an immediate tailwind for risk assets. Under those conditions, Bitcoin needs real demand to reclaim the 200-week area rather than simple relief from the flush of leverage.
A widely circulated X post captured trader psychology around the moving-average break. Social attention explains why the line is visible; price, ETF flows, and macro conditions decide whether visibility becomes support.
The three outcomes have different confirmations
The cleanest way to track the break is through conditions rather than forecasts. The same price zone can support three different interpretations depending on what happens next.
Scenario
What supports it
What weakens it
Marker to watch
Capitulation
Heavy ETF outflows and a fast drop below a watched long-term line
Persistent redemptions and no durable reclaim
BTC back above the 200-week area with ETF flows stabilizing
Lower-range acceptance
Repeated trading below the 200-week average while ETF outflows continue
A swift reclaim with improving demand
Time spent below roughly $62,383 and the next Farside flow updates
Reclaimable deviation
Spot remains close to the 200-week average and the 200-day marker is a longer repair target
Failure to regain the line despite easing selling pressure
A close back above the 200-week average, then progress toward broader trend repair
The capitulation case starts with the violence of the move: forced selling, ETF redemptions, and a sharp weekly drawdown arrived together. Confirmation would require absorption near the 200-week area and a fast return above it.
Lower-range acceptance strengthens if Bitcoin remains below the 200-week average while ETF flows remain negative. That would show buyers are allowing the old stress line to become resistance.
The reclaimable-deviation case remains viable because spot is still close to the 200-week reference. A push back above the low-$62,000 area, especially alongside smaller ETF outflows or renewed inflows, would make the break look more like a reset than a shift into a lower regime.
Even then, the 200-day average remains far overhead, so a 200-week reclaim would only be the first repair step.
The current evidence indicates that the acceptance test is still in progress. Bitcoin has crossed below the market's bear-market line, but flows and time around the low-$62,000 area will determine whether that line becomes a floor again or the ceiling of a lower range.
The post appeared first on CryptoSlate.
read the full story
Bitcoin's move below the 200-week moving-average area has turned a familiar cycle marker into a live demand test.
On Sunday, June 28, BTC traded at $60,238, down 6.1% over the past 7 days and 18% over the past 30 days. That left the spot below the 200-week weighted moving average, tracked by Newhedge at $62,383, after three heavy ETF redemption sessions.
The line now separates two near-term outcomes. A move back through the low-$62,000 area would suggest forced selling and ETF redemptions temporarily pushed Bitcoin through a level long-term holders watch. More time below it would turn the old stress marker into potential overhead resistance.
The market's focus on the level is visible in other 200-week moving-average dashboards and in social posts that framed the break as a cycle warning. A moving average can organize the test. Flow and time below the line supply the answer.
The Bitcoin price repair level is close
The 200-week weighted average is important because it compresses years of price behavior into a single slow-moving reference. Bitcoin has historically spent limited time below it during severe drawdowns, which is why traders treat it as a cycle-level stress marker.
In this setup, the gap is concrete. Bitcoin sits roughly $2,555 below Newhedge's 200-week weighted moving average. That is close enough for volatility to challenge quickly, yet large enough that hovering near $60,000 leaves the break unresolved.
The 200-day marker is part of a larger repair sequence. Barchart's technical screen showed Bitcoin's 200-day simple moving average at $84,165, far above spot. A 200-week reclaim here would test whether the breakdown is accepted; a 200-day reclaim would signal broader trend repair.
That sequence keeps the signal clean. Bitcoin can recover the 200-week line and remain in a damaged trend, while repeated failures below the 200-week area would keep pressure on the idea that the move is only a liquidation event.
ETF redemptions turned the line into a flow test
The flow backdrop makes the current move harder to dismiss as a pure chart event. Farside Investors' Bitcoin ETF table showed net outflows of $469 million on Jun. 24, $691 million on Jun. 25, and $444 million on Jun. 26.

Together, those sessions represented about $1.61 billion in net redemptions. They show that the break arrived while one of the main institutional demand channels was removing support.
Capitulation would require evidence that sellers are exhausting themselves and that buyers are absorbing supply near the level. Continued ETF redemptions would run counter to this, making a reclaim harder to sustain.
Recent CryptoSlate coverage has already addressed the near-term setup, including the $58,000 weekend exhaustion-versus-acceptance question, the ETF outflow and inflation backdrop, and liquidation pressure around the failed $60,000 rebound.

The fresh issue is whether selling pressure has pushed Bitcoin through a line that longer-cycle traders will defend, or whether the same flows make that line less relevant until demand improves.
Macro conditions add outside pressure. In its Jun. 17 statement, the Federal Reserve held its target range at 3.50% to 3.75% and said inflation remained elevated.
The Fed's June projection materials showed a median 2026 funds rate of 3.8%, while the May employment report showed payrolls rising by 172,000 and unemployment at 4.3%.

A resilient labor market and sticky inflation backdrop can keep rate-cut expectations from becoming an immediate tailwind for risk assets. Under those conditions, Bitcoin needs real demand to reclaim the 200-week area rather than simple relief from the flush of leverage.
A widely circulated X post captured trader psychology around the moving-average break. Social attention explains why the line is visible; price, ETF flows, and macro conditions decide whether visibility becomes support.
The three outcomes have different confirmations
The cleanest way to track the break is through conditions rather than forecasts. The same price zone can support three different interpretations depending on what happens next.
| Scenario | What supports it | What weakens it | Marker to watch |
|---|---|---|---|
| Capitulation | Heavy ETF outflows and a fast drop below a watched long-term line | Persistent redemptions and no durable reclaim | BTC back above the 200-week area with ETF flows stabilizing |
| Lower-range acceptance | Repeated trading below the 200-week average while ETF outflows continue | A swift reclaim with improving demand | Time spent below roughly $62,383 and the next Farside flow updates |
| Reclaimable deviation | Spot remains close to the 200-week average and the 200-day marker is a longer repair target | Failure to regain the line despite easing selling pressure | A close back above the 200-week average, then progress toward broader trend repair |
The capitulation case starts with the violence of the move: forced selling, ETF redemptions, and a sharp weekly drawdown arrived together. Confirmation would require absorption near the 200-week area and a fast return above it.
Lower-range acceptance strengthens if Bitcoin remains below the 200-week average while ETF flows remain negative. That would show buyers are allowing the old stress line to become resistance.
The reclaimable-deviation case remains viable because spot is still close to the 200-week reference. A push back above the low-$62,000 area, especially alongside smaller ETF outflows or renewed inflows, would make the break look more like a reset than a shift into a lower regime.
Even then, the 200-day average remains far overhead, so a 200-week reclaim would only be the first repair step.
The current evidence indicates that the acceptance test is still in progress. Bitcoin has crossed below the market's bear-market line, but flows and time around the low-$62,000 area will determine whether that line becomes a floor again or the ceiling of a lower range.
The post appeared first on CryptoSlate.
read the full storyOn-Chain Flow: New Wallet Withdraws 1,350 BTC From Binance
On-Chain Flow: New Wallet Withdraws 1,350 BTC From Binance: key Bitcoin whale withdrawal context,…

Capitulation Signals: 50,000 BTC Deposited to Exchanges at a Loss
Capitulation Signals: 50,000 BTC Deposited to Exchanges at a Loss: key Bitcoin capitulation context,…
Saylor hints at new Bitcoin buy as Strategy mNAV falls below 1
Michael Saylor hinted at another Strategy Bitcoin buy as mNAV falls below 1 and investors question…
Bitcoin price holds $60K as Middle East tensions fail to spark panic
Bitcoin trades near $60K as Strategy fears, Middle East tension, and on-chain reset signals leave…
Bitcoin Remains Stable at $60K Despite New Attacks Between US and Iran: Weekend Watch
M continues to drop hard, while VELVET has entered the top 100 alts after a 30%+ surge today.
Bitcoin Defends $59K Support as Q2 Closes With Rare Back-to-Back Loss
Bitcoin Defends $59K Support as Q2 Closes With Rare Back-to-Back Loss: key Bitcoin quarterly loss…
Short-Term Bitcoin Holders Dump 50,000 BTC at a Loss as Capitulation Fears Mount
Nearly 50,000 Bitcoin hit exchange addresses at a loss. Short-term holders did the dumping — newer…
Bitcoin crash warning: Novogratz says Saylor risk is real
Mike Novogratz says Bitcoin’s drop stems from Strategy stress, weak crypto sentiment, a strong…
Grayscale Wants Strategy to Dump $3 Billion in Bitcoin — CryptoQuant Says Not So Fast
What happened Zach Pandl, Grayscale’s head of research, put a number on it. He said Strategy…
Bitcoin and Gold Are Bleeding – So Where Is the Money Going?
Here's what seems to be retail investors' new attraction.
Brazil Proposes Mandatory 24-Hour Hold on Large Crypto Stablecoin Transactions
The 24-hour hold period would allow virtual asset service providers to screen the transactions and…
'The Bottom Is In': $1 Million Bitcoin Advocate Samson Mow Signals End of BTC Drop
Samson Mow dismisses technical analysis, pointing to a massive $58,000 limit order wall protecting…

Strategy Urged to Sell $3 Billion Worth of Bitcoin
Grayscale Head of Research Zach Pandl has publicly urged Strategy ($MSTR) to execute a major $3…
XRP and HYPE Keep Winning the ETF Race as SOL Joins BTC and ETH
Thursday was particularly positive days for the spot ETFs tracking Hyperliquid's token.
Grayscale's Pandl hopes Strategy sells $3B in Bitcoin to restore confidence
Grayscale's research head Zach Pandl said Strategy should sell $3 billion in Bitcoin to cover its…

Bitcoin falls below $60,000, on track for a rare back-to-back quarterly loss
The token is down nearly 7% on the week with the altcoins falling harder. Bitcoin and ether are both…
Novogratz Names Key Reason Behind Bitcoin (BTC) Price Crash
Galaxy Digital CEO Mike Novogratz has pinpointed the main factors behind the recent cryptocurrency…
Bitcoin unspent transaction outputs signal capitulation underway: analyst
“These periods have always been profitable for long-term investors,” said CryptoQuant analyst…