Bitcoin Price Analysis: BTC Must Reclaim This Level to Avoid Fresh Sub-$60K BreakdownAfter suffering one of its steepest corrections in recent months, Bitcoin is showing early signs of stabilization above a major demand zone. However, with the price still trading below several important resistance levels, the recent bounce may simply represent a temporary relief rally within a broader corrective phase.
Bitcoin Price Analysis: The Daily Chart
On the daily timeframe, BTC has found support around the critical $60K psychological support range. The blue demand zone is currently acting as the market’s primary support, as buyers have managed to defend the region so far, preventing a deeper breakdown. However, the recovery remains weak and lacks convincing bullish follow-through.
As long as Bitcoin remains below the broken support area at $65K-$66.5K and the larger supply zone around $72K-$74K, rallies are likely to be viewed as corrective rather than trend-changing. A failure to reclaim these levels could open the door for another test of the $60K region and potentially the lower boundary of the demand zone.
On the upside, BTC would need to reclaim the $66K-$67K area first before targeting the more significant resistance cluster near $73K-$74K.
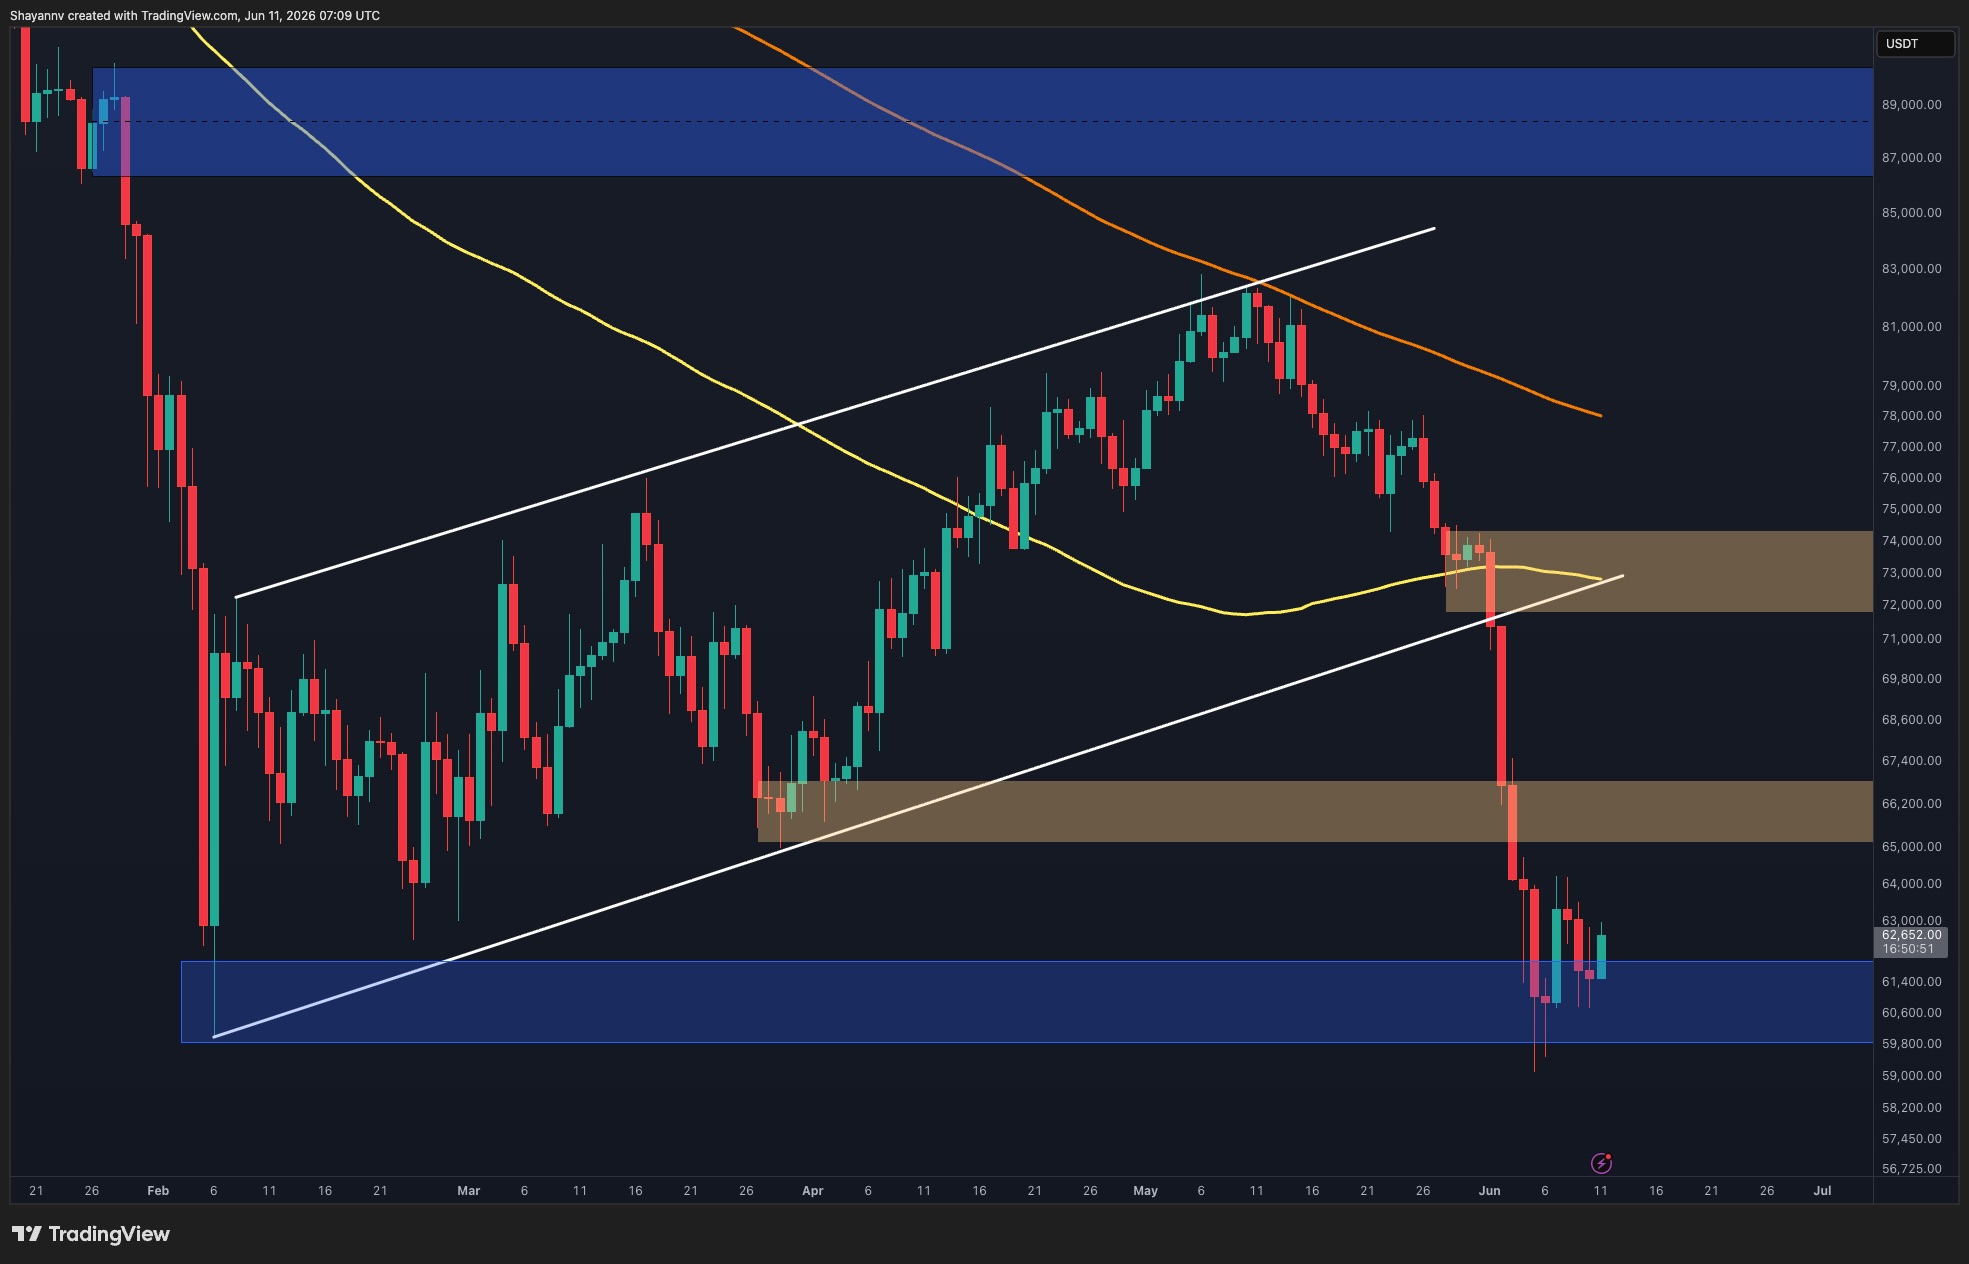
BTC/USDT 4-Hour Chart
The 4-hour chart provides a clearer picture of the ongoing consolidation. Following the steep decline from above $73K, Bitcoin found support inside the $59K-$62K demand zone and has since developed a rising wedge formation.
While the pattern reflects short-term recovery efforts, rising wedges frequently act as bearish continuation structures when they emerge after strong downtrends. Price is currently trading near $62.7K while approaching the wedge’s lower support line.
This creates an important short-term inflection point. A breakdown below the rising wedge could trigger another wave of selling pressure, potentially sending BTC back toward the $60K support area and possibly the lower boundary near $59K.
Meanwhile, any recovery attempt is likely to encounter significant resistance around $65K-$68K, where a fresh supply zone has formed following the recent breakdown. This area represents the first major obstacle for bulls and could attract renewed selling interest if tested.
From a short-term perspective, the structure currently favors a pullback scenario unless buyers can invalidate the bearish setup by breaking above the wedge resistance and reclaiming the nearby supply zone.
Onchain Analysis
The Bitcoin Realized Price metric continues to provide an important perspective on the broader market cycle. Realized Price, which represents the average acquisition cost of all circulating BTC, currently sits around $53.5K, while spot price remains near $62.5K.
Historically, Bitcoin tends to maintain bullish market conditions while trading above its realized price. Despite the recent correction, BTC still holds a meaningful premium above this level, suggesting that the broader cycle structure remains constructive.
However, the chart also shows that the realized price has flattened in recent months after a strong rise throughout 2024 and 2025. This slowdown reflects reduced capital inflows and a cooling phase in investor activity.
As a result, although the long-term on-chain picture remains supportive, it does not necessarily prevent additional short-term downside. Similar periods in previous cycles often saw prolonged consolidations and multiple retests of support before a stronger trend resumed.
For now, the combination of weakening technical structure and a still-positive on-chain backdrop suggests that Bitcoin may experience further pullbacks toward the $60K support region before attempting a more sustainable recovery.
The post appeared first on CryptoPotato.
read the full story
After suffering one of its steepest corrections in recent months, Bitcoin is showing early signs of stabilization above a major demand zone. However, with the price still trading below several important resistance levels, the recent bounce may simply represent a temporary relief rally within a broader corrective phase.
Bitcoin Price Analysis: The Daily Chart
On the daily timeframe, BTC has found support around the critical $60K psychological support range. The blue demand zone is currently acting as the market’s primary support, as buyers have managed to defend the region so far, preventing a deeper breakdown. However, the recovery remains weak and lacks convincing bullish follow-through.
As long as Bitcoin remains below the broken support area at $65K-$66.5K and the larger supply zone around $72K-$74K, rallies are likely to be viewed as corrective rather than trend-changing. A failure to reclaim these levels could open the door for another test of the $60K region and potentially the lower boundary of the demand zone.
On the upside, BTC would need to reclaim the $66K-$67K area first before targeting the more significant resistance cluster near $73K-$74K.
BTC/USDT 4-Hour Chart
The 4-hour chart provides a clearer picture of the ongoing consolidation. Following the steep decline from above $73K, Bitcoin found support inside the $59K-$62K demand zone and has since developed a rising wedge formation.
While the pattern reflects short-term recovery efforts, rising wedges frequently act as bearish continuation structures when they emerge after strong downtrends. Price is currently trading near $62.7K while approaching the wedge’s lower support line.
This creates an important short-term inflection point. A breakdown below the rising wedge could trigger another wave of selling pressure, potentially sending BTC back toward the $60K support area and possibly the lower boundary near $59K.
Meanwhile, any recovery attempt is likely to encounter significant resistance around $65K-$68K, where a fresh supply zone has formed following the recent breakdown. This area represents the first major obstacle for bulls and could attract renewed selling interest if tested.
From a short-term perspective, the structure currently favors a pullback scenario unless buyers can invalidate the bearish setup by breaking above the wedge resistance and reclaiming the nearby supply zone.
Onchain Analysis
The Bitcoin Realized Price metric continues to provide an important perspective on the broader market cycle. Realized Price, which represents the average acquisition cost of all circulating BTC, currently sits around $53.5K, while spot price remains near $62.5K.
Historically, Bitcoin tends to maintain bullish market conditions while trading above its realized price. Despite the recent correction, BTC still holds a meaningful premium above this level, suggesting that the broader cycle structure remains constructive.
However, the chart also shows that the realized price has flattened in recent months after a strong rise throughout 2024 and 2025. This slowdown reflects reduced capital inflows and a cooling phase in investor activity.
As a result, although the long-term on-chain picture remains supportive, it does not necessarily prevent additional short-term downside. Similar periods in previous cycles often saw prolonged consolidations and multiple retests of support before a stronger trend resumed.
For now, the combination of weakening technical structure and a still-positive on-chain backdrop suggests that Bitcoin may experience further pullbacks toward the $60K support region before attempting a more sustainable recovery.
The post appeared first on CryptoPotato.
read the full story‘We Will Be Taking Kharg Island’ Trump Warning Puts Oil, Stocks and Bitcoin on Alert
Trump’s Iran warning and 6.5% PPI put oil, bitcoin, and equities on alert as traders weigh…
Bitcoin Miners Under Pressure: Are We Approaching Another Capitulation?
TL;DR: Bitcoin’s Puell Multiple 30DMA fell to 0.74, signaling that miners are approaching the…
Is Bitcoin setting up for rebound as $190mln whale accumulation grows?
Bitcoin whales accumulated over $190 million as exchange outflows dominated and BTC defended…
Nakamoto refinances Kraken debt while trading far below Bitcoin NAV
Bitcoin treasury firm Nakamoto restructured debt and authorized a share buyback as investors…
Bitcoin stumbles as record PPI reading clouds Fed outlook
Bitcoin has fallen back toward $62,500 after U.S. producer inflation accelerated beyond…
BlackRock races Goldman Sachs to turn Bitcoin volatility into ETF income
BlackRock has updated its regulatory filing for a new Bitcoin Premium Income ETF, signaling an…
Analyst Benjamin Cowen Says Bitcoin Now in the Final Stage of the Bear Market – Here’s His Timeline
Crypto analyst Benjamin Cowen thinks Bitcoin (BTC) is nearing the end of the bear market. In a new…

Miners' Revenue Squeeze Set to Force Bitcoin's Biggest Network Correction Since 2021
Miners are unplugging and a drop to $31,500 may come next for Bitcoin.

Banks Say Stablecoin Rules Should Cover Secondary Markets
Banking industry trade groups argue AML rules should focus on higher-risk activity while addressing…
Fold sells $45 mln worth of Bitcoin amidst volatile market conditions – Debt alarm?
Why would a business that focuses on Bitcoin lower its exposure to the crypto market at a time when…
Bitcoin Has Never Broken This Line Before And Price Just Touched It Again
Crypto analyst Crypto Rover has pointed to a trendline that Bitcoin has never broken below in every…

Nakamoto Fuels 20% Surge for NAKA Stock With Latest Bitcoin Sale
Nakamoto sold 600 Bitcoin to repay $45 million in Kraken debt, extended loans to 2027, and approved…

Bitcoin tags $63.2K as BTC price action ignores inflation, Iran Hormuz closure
Bitcoin mostly preserved a recent rebound despite the highest US PPI inflation since October 2022…

It's not SpaceX. Bitcoin ETF outflows may be an arbitrage story
While some analysts argue investors are selling bitcoin to free up capital for anticipated IPOs such…
Bitcoin ETFs Shed $2.1B in June So Far as Market Selloff Deepens
The pace of outflows from U.S. spot Bitcoin ETFs has “moderated,” with analysts assessing…
Bitcoin’s $60,000 support is still a bet on the dollar breaking
Glassnode's latest Week On-chain report says Bitcoin has entered a deep discount phase, with over…
Bitcoin Traders Eye $64K Resistance as RSI Hangs at the Lowest Level Since November 2018
Bitcoin rebounded 2.3% on June 11, 2026, climbing from a session low of $60,914 to a high of…
Trump Moves Bitcoin and Oil Markets Hard With Latest Iran Threat
Trump threatens to seize Iran's Kharg Island. Oil climbs above $91 while Bitcoin holds near $62,800…
Wall Street Giant BlackRock Is About to Launch a Yield-Bearing Bitcoin ETF
TL;DR: BlackRock is nearing launch of the iShares Bitcoin Premium Income ETF, expected to trade on…
Why The Bitcoin Price Could Mark A Generational Bottom And Rise Over 200%
Bitcoin’s investor sentiment is in ruins, but buried inside the wreckage, a technical signal…