Bitcoin Price Analysis: BTC’s Recovery Hangs on One Critical Support LevelBitcoin’s recovery has slowed after reaching a key resistance cluster, with the asset now consolidating beneath an important supply zone. The latest price action suggests that bulls are attempting to maintain momentum, but the market remains at a critical level where the next breakout or rejection could determine the short-term trend.
Bitcoin Price Analysis: The Daily Chart
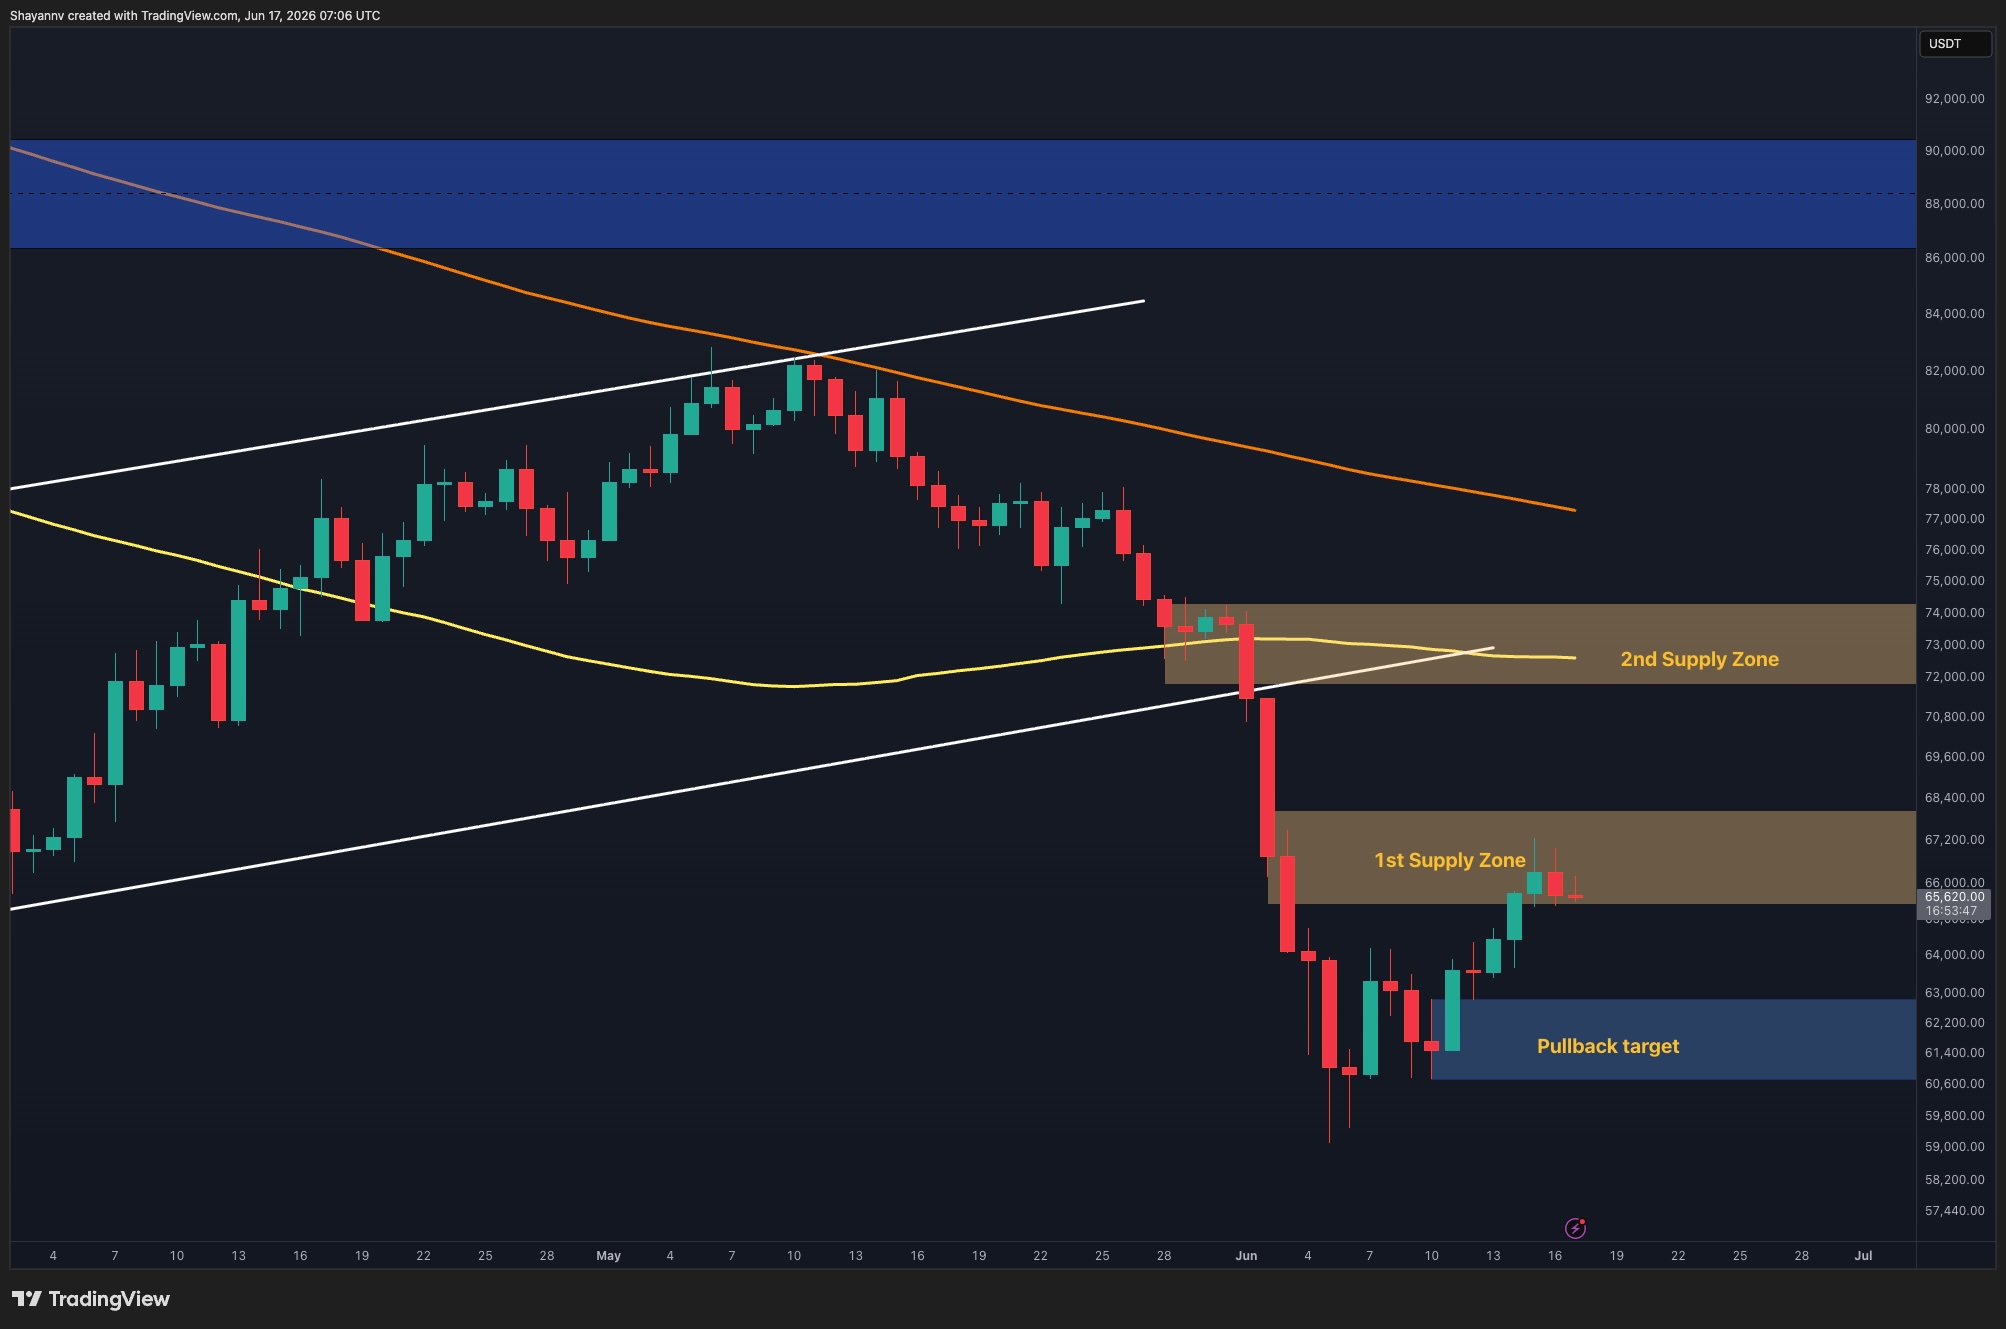
On the daily timeframe, BTC is trading around $65K after rebounding from the $60K support region earlier this month. The recovery has brought the price directly into the first major supply zone between $65K and $67K, where sellers have started to emerge.
The most recent candles show consolidation inside this resistance area rather than an immediate rejection, which is generally a constructive sign for buyers. However, BTC still trades below the 100-day moving average near $72K and the 200-day moving average around $77K, indicating that the broader trend has yet to fully recover.
If buyers manage to reclaim the current supply zone, the next upside target would be the higher resistance region between $72K and $74K. This area aligns with the second supply zone, the 100-day moving average, and the lower boundary of the previously broken ascending channel, making it the next major hurdle for the market.
On the downside, the $60K-$62K area remains the key support zone. As long as BTC holds above this region, the recent recovery structure remains intact.
BTC/USDT 4-Hour Chart
The 4-hour chart highlights the recent rally into the $65K to $67K supply zone following a breakout from the ascending recovery channel. After reaching the upper boundary of the zone near $66.8K, BTC has entered a period of sideways consolidation.
The latest price action suggests that neither bulls nor bears currently have full control. The asset continues to hold above the former breakout region around $64K to $65K, while sellers have so far prevented a decisive move through the supply zone.
A breakout above $67K would strengthen the bullish case and could open the path toward the higher resistance area around $72K. Conversely, losing the $64K support region would likely trigger a deeper pullback toward the $61K to $62K demand zone.
For now, the short-term structure remains constructive as long as higher lows continue to develop above the recent breakout area.

Sentiment Analysis
The Binance liquidation heatmap shows a notable concentration of liquidity both above and below the current price, but the nearest and most significant cluster is located between $67K and $69K.
Since BTC is currently consolidating around $65K, this overhead liquidity zone could act as a short-term magnet. A push through the current supply region may trigger short liquidations and accelerate momentum toward the $68K to $69K area.
Meanwhile, a substantial liquidity pocket remains below the market, between $62K and $63K. Should BTC lose the $64K support area, the market could be drawn lower to collect this liquidity before establishing the next directional move.
Overall, the heatmap suggests that the market is currently trapped between two major liquidity pools. Given the proximity of the upper cluster and BTC’s ability to hold within the $65K to $67K resistance zone, the short-term bias remains slightly tilted toward an upside liquidity sweep into the $67K to $69K region before a larger directional decision emerges.

The post appeared first on CryptoPotato.
read the full story
Bitcoin’s recovery has slowed after reaching a key resistance cluster, with the asset now consolidating beneath an important supply zone. The latest price action suggests that bulls are attempting to maintain momentum, but the market remains at a critical level where the next breakout or rejection could determine the short-term trend.
Bitcoin Price Analysis: The Daily Chart
On the daily timeframe, BTC is trading around $65K after rebounding from the $60K support region earlier this month. The recovery has brought the price directly into the first major supply zone between $65K and $67K, where sellers have started to emerge.
The most recent candles show consolidation inside this resistance area rather than an immediate rejection, which is generally a constructive sign for buyers. However, BTC still trades below the 100-day moving average near $72K and the 200-day moving average around $77K, indicating that the broader trend has yet to fully recover.
If buyers manage to reclaim the current supply zone, the next upside target would be the higher resistance region between $72K and $74K. This area aligns with the second supply zone, the 100-day moving average, and the lower boundary of the previously broken ascending channel, making it the next major hurdle for the market.
On the downside, the $60K-$62K area remains the key support zone. As long as BTC holds above this region, the recent recovery structure remains intact.
BTC/USDT 4-Hour Chart
The 4-hour chart highlights the recent rally into the $65K to $67K supply zone following a breakout from the ascending recovery channel. After reaching the upper boundary of the zone near $66.8K, BTC has entered a period of sideways consolidation.
The latest price action suggests that neither bulls nor bears currently have full control. The asset continues to hold above the former breakout region around $64K to $65K, while sellers have so far prevented a decisive move through the supply zone.
A breakout above $67K would strengthen the bullish case and could open the path toward the higher resistance area around $72K. Conversely, losing the $64K support region would likely trigger a deeper pullback toward the $61K to $62K demand zone.
For now, the short-term structure remains constructive as long as higher lows continue to develop above the recent breakout area.
Sentiment Analysis
The Binance liquidation heatmap shows a notable concentration of liquidity both above and below the current price, but the nearest and most significant cluster is located between $67K and $69K.
Since BTC is currently consolidating around $65K, this overhead liquidity zone could act as a short-term magnet. A push through the current supply region may trigger short liquidations and accelerate momentum toward the $68K to $69K area.
Meanwhile, a substantial liquidity pocket remains below the market, between $62K and $63K. Should BTC lose the $64K support area, the market could be drawn lower to collect this liquidity before establishing the next directional move.
Overall, the heatmap suggests that the market is currently trapped between two major liquidity pools. Given the proximity of the upper cluster and BTC’s ability to hold within the $65K to $67K resistance zone, the short-term bias remains slightly tilted toward an upside liquidity sweep into the $67K to $69K region before a larger directional decision emerges.
The post appeared first on CryptoPotato.
read the full storyStablecoin Shakedown: Binance, Coinbase And Kraken Restrict USDT In Europe Ahead Of MiCA Deadline
Major exchanges continue reshaping USDT access for EEA users as Europe’s MiCA stablecoin rules…

Trader Garrett Jin Dumps $13.5M in HYPE, Holds $83M BTC and $25M ZEC Longs
A wallet tied to former Bitforex chief Garrett Jin has sold its entire 184,102 HYPE stake, worth…
Bitcoin Dips Below $65K Then Bounces as Warsh Holds Rates at 3.75%
Bitcoin got rattled — briefly — and then shrugged it off. That’s basically the story of…
Bitcoin drops toward $64K after hawkish Fed sparks liquidation cascade
Bitcoin has fallen back toward $64,000 after a hawkish Federal Reserve outlook erased a relief rally…
New Fed Era Begins: Bitcoin Drops as Warsh Emphasizes Price Stability
TL;DR: The Federal Open Market Committee maintained the federal funds rate target range between 3.5%…
$400M Wiped Out in Hours as Bitcoin Crashes After FOMC and Warsh Speech
The asset has slipped by over $2,000 since the meeting concluded.
QCP warns Strategy may sell more Bitcoin to fund dividends
Strategy has returned to the spotlight after QCP estimated its current liquidity runway for dividend…
Bitcoin bottom? BTC builds massive support wall amid ‘one of the largest transfers ever’
Has Bitcoin found a bottom strong enough to withstand the bears?
Fidelity joins Wall Street's race to manage stablecoin reserves
Following State Street, Fidelity is targeting reserve assets that underpin the expanding stablecoin…
Kevin Warsh Sends Bitcoin and Gold Lower in First FOMC Press Conference: What Did He Say?
Kevin Warsh delivered his first press conference as Fed chair on Wednesday, June 17, 2026. Gold and…

Blackrock Leads Crypto ETF Inflows as Bitcoin, Ether and XRP All Turn Positive
Crypto ETF flows turned positive across the board on Tuesday, June 16, with bitcoin, ether, HYPE,…
Bitcoin capitulation ‘twice as weak’ after spot liquidity turns supportive: Glassnode
Bitcoin’s realized losses fell by 46% as increasing bid-side liquidity points to easing sell…

CoinFund, Coinbase Back Stablecoin Payments Startup Trace Finance in $32 Million Raise
Stablecoin infrastructure firm Trace Finance said Wednesday that it raised a $32 million Series A…
Bitcoin layer-2s face a bear-market reality check
Botanix's shutdown has raised an uncomfortable question for Bitcoin builders: Does the market…
Elon Musk’s wealth has now surpassed Bitcoin market cap amid SpaceX’s continued rally
Elon Musk’s personal fortune has surpassed the market value of Bitcoin, a milestone that shows how…
‘Bitcoin Rodney’ Pleads Guilty in $1.8 Billion Crypto Fraud Case
TL;DR: Rodney Burton illegally operated a money transmitting network between June 2020 and January…
Bitcoin Slides as Fed Says It Will 'Deliver Price Stability' Under Kevin Warsh
The first FOMC meeting under new Federal Reserve Chair Kevin Warsh produced the expected result, yet…
Japan’s Three Largest Megabanks Align To Launch Joint Yen-Backed Stablecoin By March 2027
Japan’s largest banking groups are moving toward a joint yen-backed stablecoin framework that…
BTC Price Drops as New Fed Chair Kevin Warsh Holds Rates Steady
The decision was highly anticipated but there are still some fears about potential hikes by the end…