Bitcoin Price Analysis: BTC’s Recovery Hangs on One Critical Support LevelBitcoin’s recovery has slowed after reaching a key resistance cluster, with the asset now consolidating beneath an important supply zone. The latest price action suggests that bulls are attempting to maintain momentum, but the market remains at a critical level where the next breakout or rejection could determine the short-term trend.
Bitcoin Price Analysis: The Daily Chart
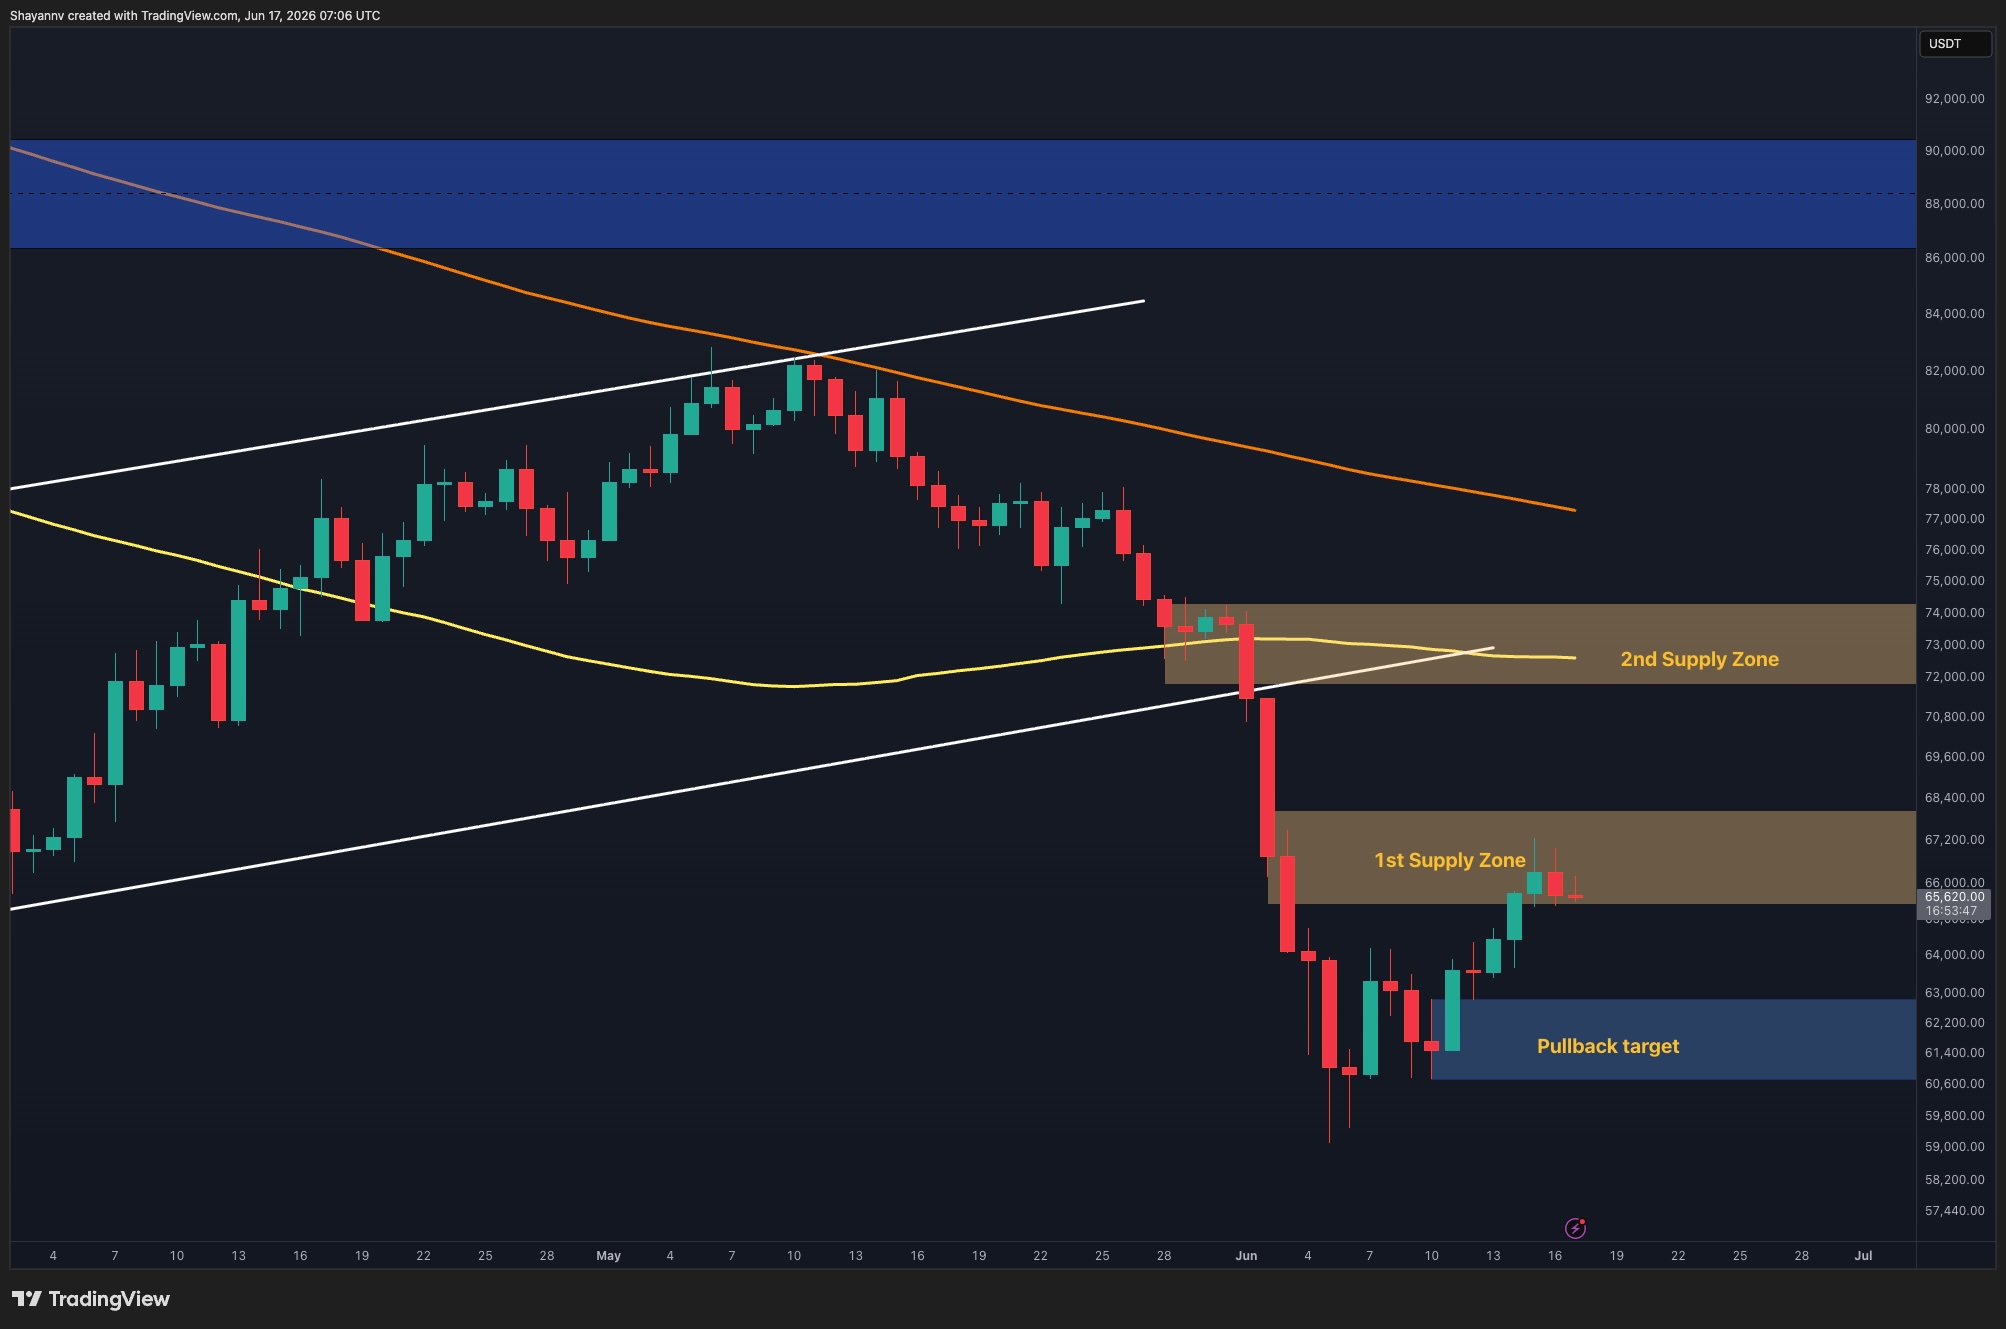
On the daily timeframe, BTC is trading around $65K after rebounding from the $60K support region earlier this month. The recovery has brought the price directly into the first major supply zone between $65K and $67K, where sellers have started to emerge.
The most recent candles show consolidation inside this resistance area rather than an immediate rejection, which is generally a constructive sign for buyers. However, BTC still trades below the 100-day moving average near $72K and the 200-day moving average around $77K, indicating that the broader trend has yet to fully recover.
If buyers manage to reclaim the current supply zone, the next upside target would be the higher resistance region between $72K and $74K. This area aligns with the second supply zone, the 100-day moving average, and the lower boundary of the previously broken ascending channel, making it the next major hurdle for the market.
On the downside, the $60K-$62K area remains the key support zone. As long as BTC holds above this region, the recent recovery structure remains intact.
BTC/USDT 4-Hour Chart
The 4-hour chart highlights the recent rally into the $65K to $67K supply zone following a breakout from the ascending recovery channel. After reaching the upper boundary of the zone near $66.8K, BTC has entered a period of sideways consolidation.
The latest price action suggests that neither bulls nor bears currently have full control. The asset continues to hold above the former breakout region around $64K to $65K, while sellers have so far prevented a decisive move through the supply zone.
A breakout above $67K would strengthen the bullish case and could open the path toward the higher resistance area around $72K. Conversely, losing the $64K support region would likely trigger a deeper pullback toward the $61K to $62K demand zone.
For now, the short-term structure remains constructive as long as higher lows continue to develop above the recent breakout area.

Sentiment Analysis
The Binance liquidation heatmap shows a notable concentration of liquidity both above and below the current price, but the nearest and most significant cluster is located between $67K and $69K.
Since BTC is currently consolidating around $65K, this overhead liquidity zone could act as a short-term magnet. A push through the current supply region may trigger short liquidations and accelerate momentum toward the $68K to $69K area.
Meanwhile, a substantial liquidity pocket remains below the market, between $62K and $63K. Should BTC lose the $64K support area, the market could be drawn lower to collect this liquidity before establishing the next directional move.
Overall, the heatmap suggests that the market is currently trapped between two major liquidity pools. Given the proximity of the upper cluster and BTC’s ability to hold within the $65K to $67K resistance zone, the short-term bias remains slightly tilted toward an upside liquidity sweep into the $67K to $69K region before a larger directional decision emerges.

The post appeared first on CryptoPotato.
read the full story
Bitcoin’s recovery has slowed after reaching a key resistance cluster, with the asset now consolidating beneath an important supply zone. The latest price action suggests that bulls are attempting to maintain momentum, but the market remains at a critical level where the next breakout or rejection could determine the short-term trend.
Bitcoin Price Analysis: The Daily Chart
On the daily timeframe, BTC is trading around $65K after rebounding from the $60K support region earlier this month. The recovery has brought the price directly into the first major supply zone between $65K and $67K, where sellers have started to emerge.
The most recent candles show consolidation inside this resistance area rather than an immediate rejection, which is generally a constructive sign for buyers. However, BTC still trades below the 100-day moving average near $72K and the 200-day moving average around $77K, indicating that the broader trend has yet to fully recover.
If buyers manage to reclaim the current supply zone, the next upside target would be the higher resistance region between $72K and $74K. This area aligns with the second supply zone, the 100-day moving average, and the lower boundary of the previously broken ascending channel, making it the next major hurdle for the market.
On the downside, the $60K-$62K area remains the key support zone. As long as BTC holds above this region, the recent recovery structure remains intact.
BTC/USDT 4-Hour Chart
The 4-hour chart highlights the recent rally into the $65K to $67K supply zone following a breakout from the ascending recovery channel. After reaching the upper boundary of the zone near $66.8K, BTC has entered a period of sideways consolidation.
The latest price action suggests that neither bulls nor bears currently have full control. The asset continues to hold above the former breakout region around $64K to $65K, while sellers have so far prevented a decisive move through the supply zone.
A breakout above $67K would strengthen the bullish case and could open the path toward the higher resistance area around $72K. Conversely, losing the $64K support region would likely trigger a deeper pullback toward the $61K to $62K demand zone.
For now, the short-term structure remains constructive as long as higher lows continue to develop above the recent breakout area.
Sentiment Analysis
The Binance liquidation heatmap shows a notable concentration of liquidity both above and below the current price, but the nearest and most significant cluster is located between $67K and $69K.
Since BTC is currently consolidating around $65K, this overhead liquidity zone could act as a short-term magnet. A push through the current supply region may trigger short liquidations and accelerate momentum toward the $68K to $69K area.
Meanwhile, a substantial liquidity pocket remains below the market, between $62K and $63K. Should BTC lose the $64K support area, the market could be drawn lower to collect this liquidity before establishing the next directional move.
Overall, the heatmap suggests that the market is currently trapped between two major liquidity pools. Given the proximity of the upper cluster and BTC’s ability to hold within the $65K to $67K resistance zone, the short-term bias remains slightly tilted toward an upside liquidity sweep into the $67K to $69K region before a larger directional decision emerges.
The post appeared first on CryptoPotato.
read the full storyYield Basis Deposits Jump 120% in 2 Weeks as Investors Seek BTC Yield Without Selling
Yield Basis says deposits into its new Hybrid Vaults rose more than 120% in under two weeks,…
Trump Signs the US-Iran Peace MoU, but the Fed Stops Bitcoin’s Recovery Cold
Donald Trump signed the US-Iran peace Memorandum of Understanding (MoU), marking a historic…

Bitcoin Whale Wallets See Major Rebound
Bitcoin's largest holders are staging a massive accumulation campaign, reversing months of selling…

Live markets: Bitcoin and ether ETFs lost $111 million combined as rate-cut hopes died
Total market value has held flat near $2.26 trillion since Tuesday, with the recovery losing…
Buying bitcoin below its 200-week average has historically delivered over 100% in median returns, Kraken says
Bitcoin briefly slipped below its 200-week moving average twice in the past two weeks, a rare event…
Michael Saylor Calls Bitcoin the Base Layer for a New Digital Capital Stack
The Strategy chair believes Bitcoin can jump 500-fold, but this depends more on large-scale…
HyperFund Promoter ‘Bitcoin Rodney’ Pleads Guilty in $1.8 Billion Crypto Scam
HyperFund drew $1.8 billion from investors worldwide through a crypto platform prosecutors described…
Bitcoin, ether slide after a hawkish Fed, even as Trump's signed Iran deal lifts stocks
The Fed held rates but signaled it is more worried about inflation than growth in Chair Kevin…
Tether winds down gold-backed derivative stablecoin aUSDT
Tether is focusing on stronger user demand, deeper liquidity, and broader long-term market…

Oman Launches Mandatory National Bitcoin Mining Pool In Sovereign Regulatory Push
Omanhash.om is being positioned as the official mining pool for licensed crypto miners in Oman,…

Bitcoin Eyes $70K Breakout as 21Shares Sees Path Toward $100K by Q3
Bitcoin remains above a key support zone despite a Federal Reserve-driven pullback, while 21Shares…
France to Phase Out Non-Quantum Encryption as Bitcoin Security Concerns Grow
French authorities said that government cybersecurity researchers will stop certifying security…
Hyperliquid (HYPE), Bitcoin (BTC), XRP and Dogecoin (DOGE) Price Analysis for June 17: Reclaiming the Bullish Narrative
Crypto markets are showing mixed recovery signals, with some assets holding strong uptrends while…
Illinois Targets Bitcoin Transactions With New Tax Critics Call ‘Punitive’
TL;DR: Levy amount: The legislation permanently establishes a 0.2% rate on the transfer or purchase…
Trace Finance Takes $32M Series A to Scale the Bank Layer Stablecoins Are Missing
Trace Finance, a regulated cross-border payments company, closed a $32 million Series A to extend…
Bitcoin Dips Below $65K Then Bounces as Warsh Holds Rates at 3.75%
Bitcoin got rattled — briefly — and then shrugged it off. That’s basically the story of…
Bitcoin drops toward $64K after hawkish Fed sparks liquidation cascade
Bitcoin has fallen back toward $64,000 after a hawkish Federal Reserve outlook erased a relief rally…
Stablecoin Shakedown: Binance, Coinbase And Kraken Restrict USDT In Europe Ahead Of MiCA Deadline
Major exchanges continue reshaping USDT access for EEA users as Europe’s MiCA stablecoin rules…