Bitcoin Price Analysis: BTC’s Structure Remains Bearish Until This Key Level Is ReclaimedBitcoin continues to recover from its recent sell-off, but the market remains trapped beneath a major resistance cluster that has capped every relief rally since the June breakdown. While short-term momentum has improved, BTC is now approaching a decisive area where the next move could determine whether the recovery evolves into a larger trend reversal or remains a corrective bounce within a broader bearish structure.
Bitcoin Price Analysis: The Daily Chart
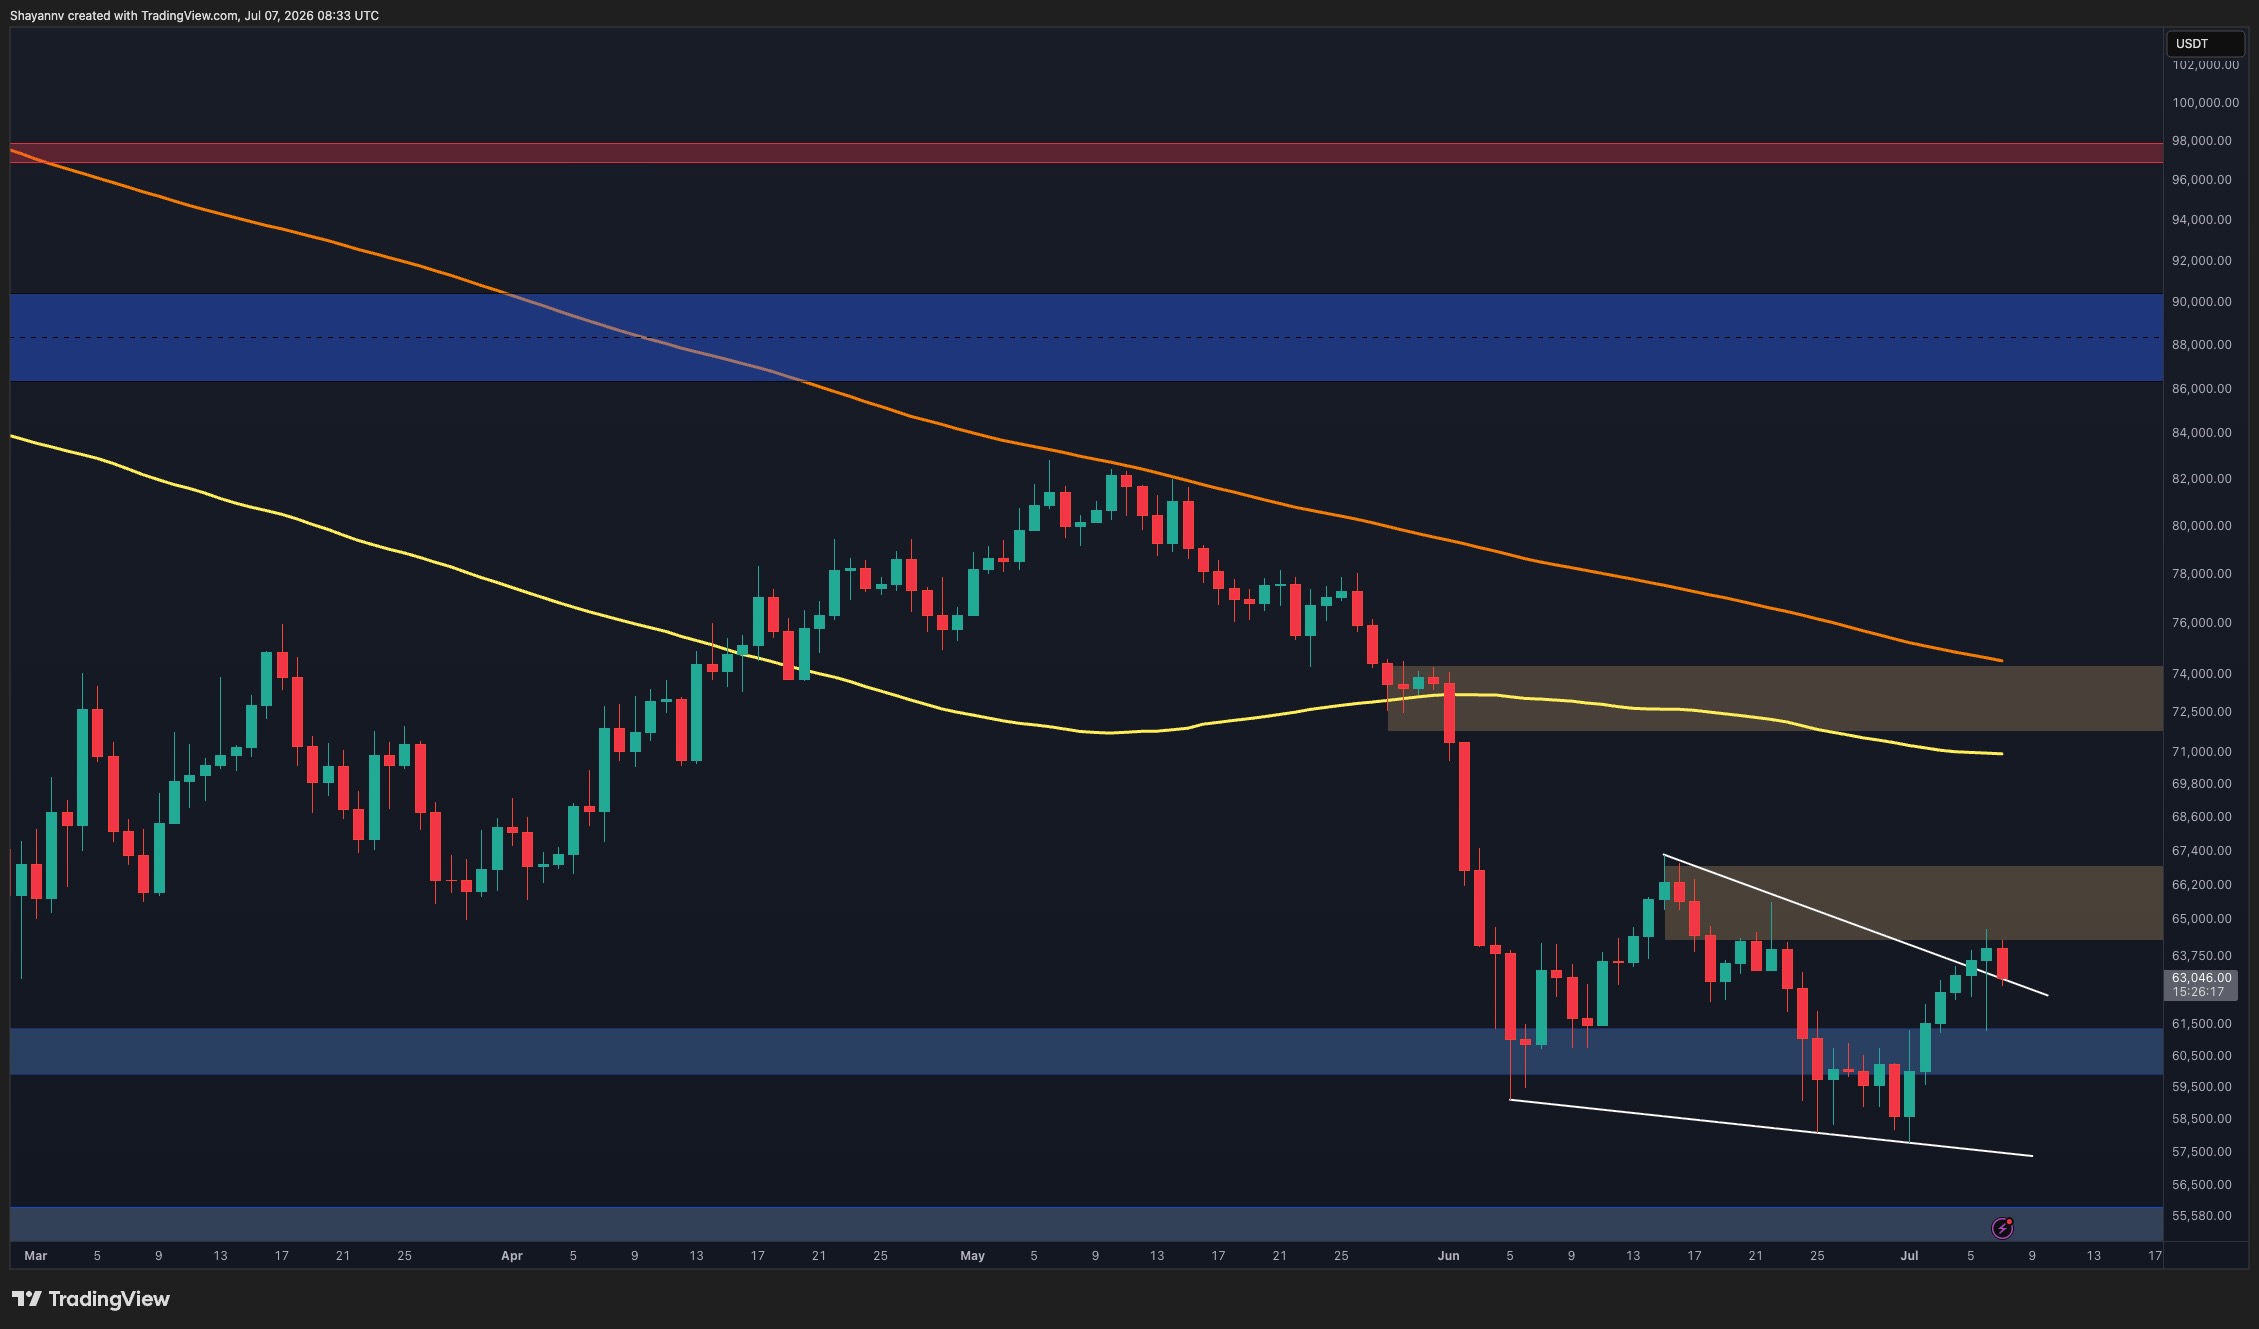
On the daily timeframe, Bitcoin remains in a clear downtrend, trading below the 100-day and 200-day moving averages, both of which continue to slope lower. The recent recovery from the $58K-$61K demand zone has helped stabilize the price action, but the asset is still trading beneath the major resistance area between $64K and $66.5K.
It recently formed another higher low inside the broader support region, while the RSI has continued to print higher lows despite the weakness seen throughout June. This developing bullish divergence suggests that downside momentum is fading and that buyers are gradually regaining control.
However, the market structure remains bearish until Bitcoin can reclaim the $64K-$66.5K supply zone. This area aligns with previous support turned resistance and continues to act as the primary obstacle preventing a larger recovery. A successful breakout above this region would likely expose the next major resistance near $72K-$74K, while rejection could send the price back toward the $60K support zone.
BTC/USDT 4-Hour Chart
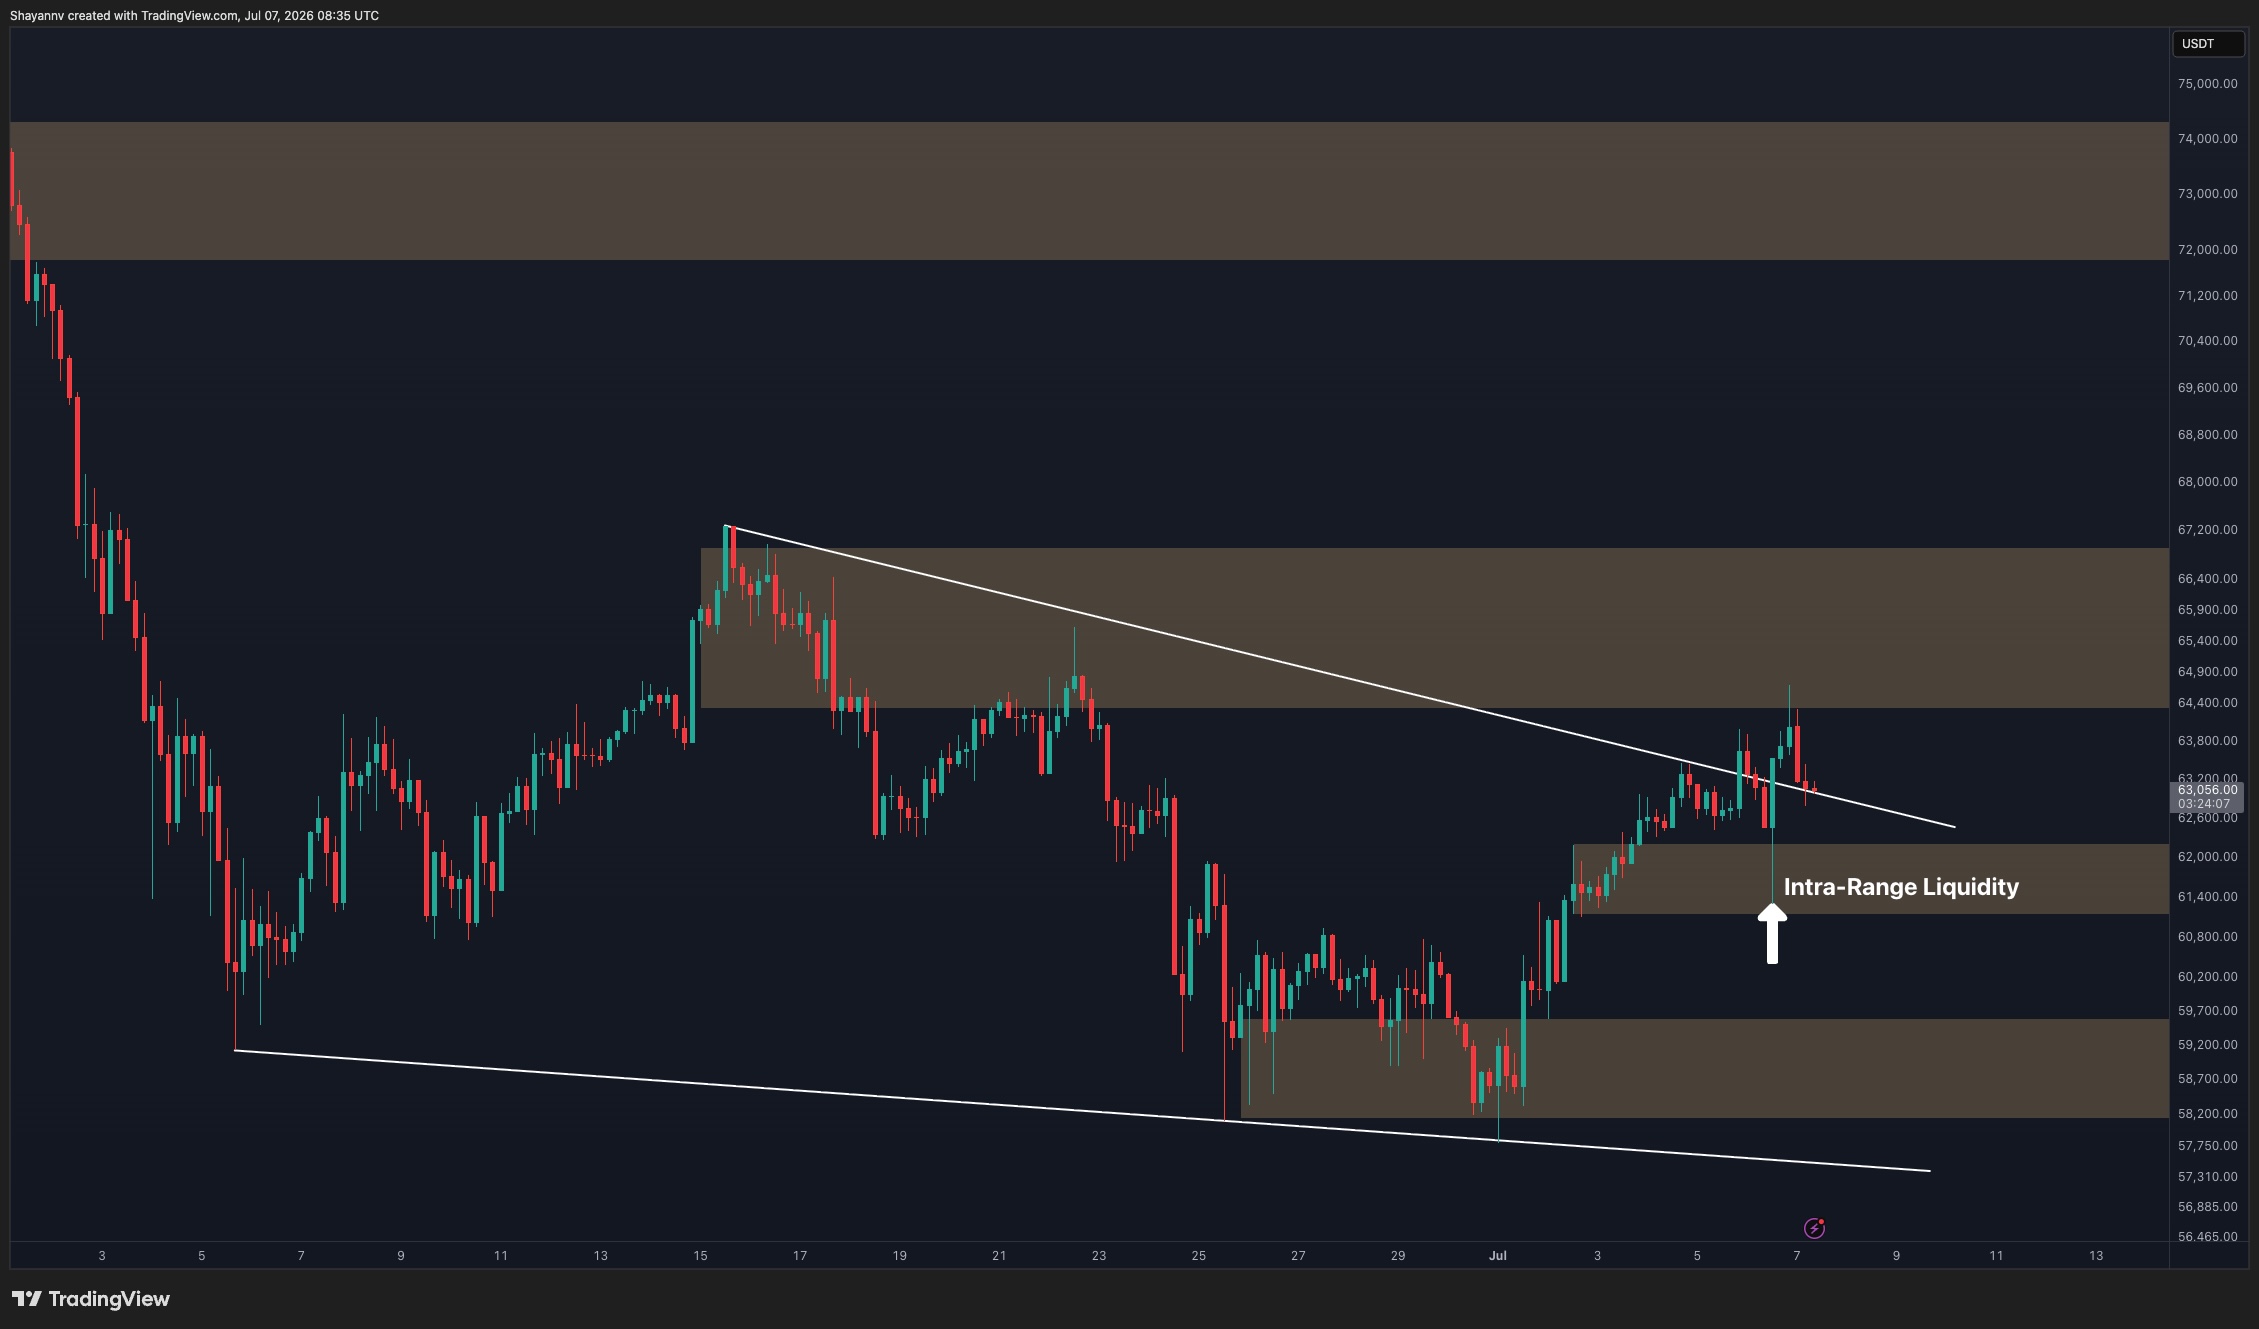
The 4-hour chart shows a much more constructive picture. After establishing a base around the $58K-$59K demand region, Bitcoin produced a strong impulsive rally and pushed directly into the descending trendline that has defined the corrective structure since mid-June.
The asset recently swept the local liquidity resting above previous highs within the $61K-$62K region before encountering resistance near the descending trendline. This liquidity grab is important because it removed nearby buy-side liquidity and allowed the market to test a key technical level.
The current structure suggests that Bitcoin is attempting to transition from a series of lower highs into a potential breakout formation. A confirmed move above the descending trendline and the $64K-$66K resistance zone would significantly improve the bullish outlook and could accelerate upside momentum toward higher resistance levels.
Conversely, failure to break the trendline could trigger another period of consolidation between the $60K support and the $64K-$66K supply zone. As long as Bitcoin holds above the $60K-$61K support area, the short-term recovery structure remains intact.
Sentiment Analysis
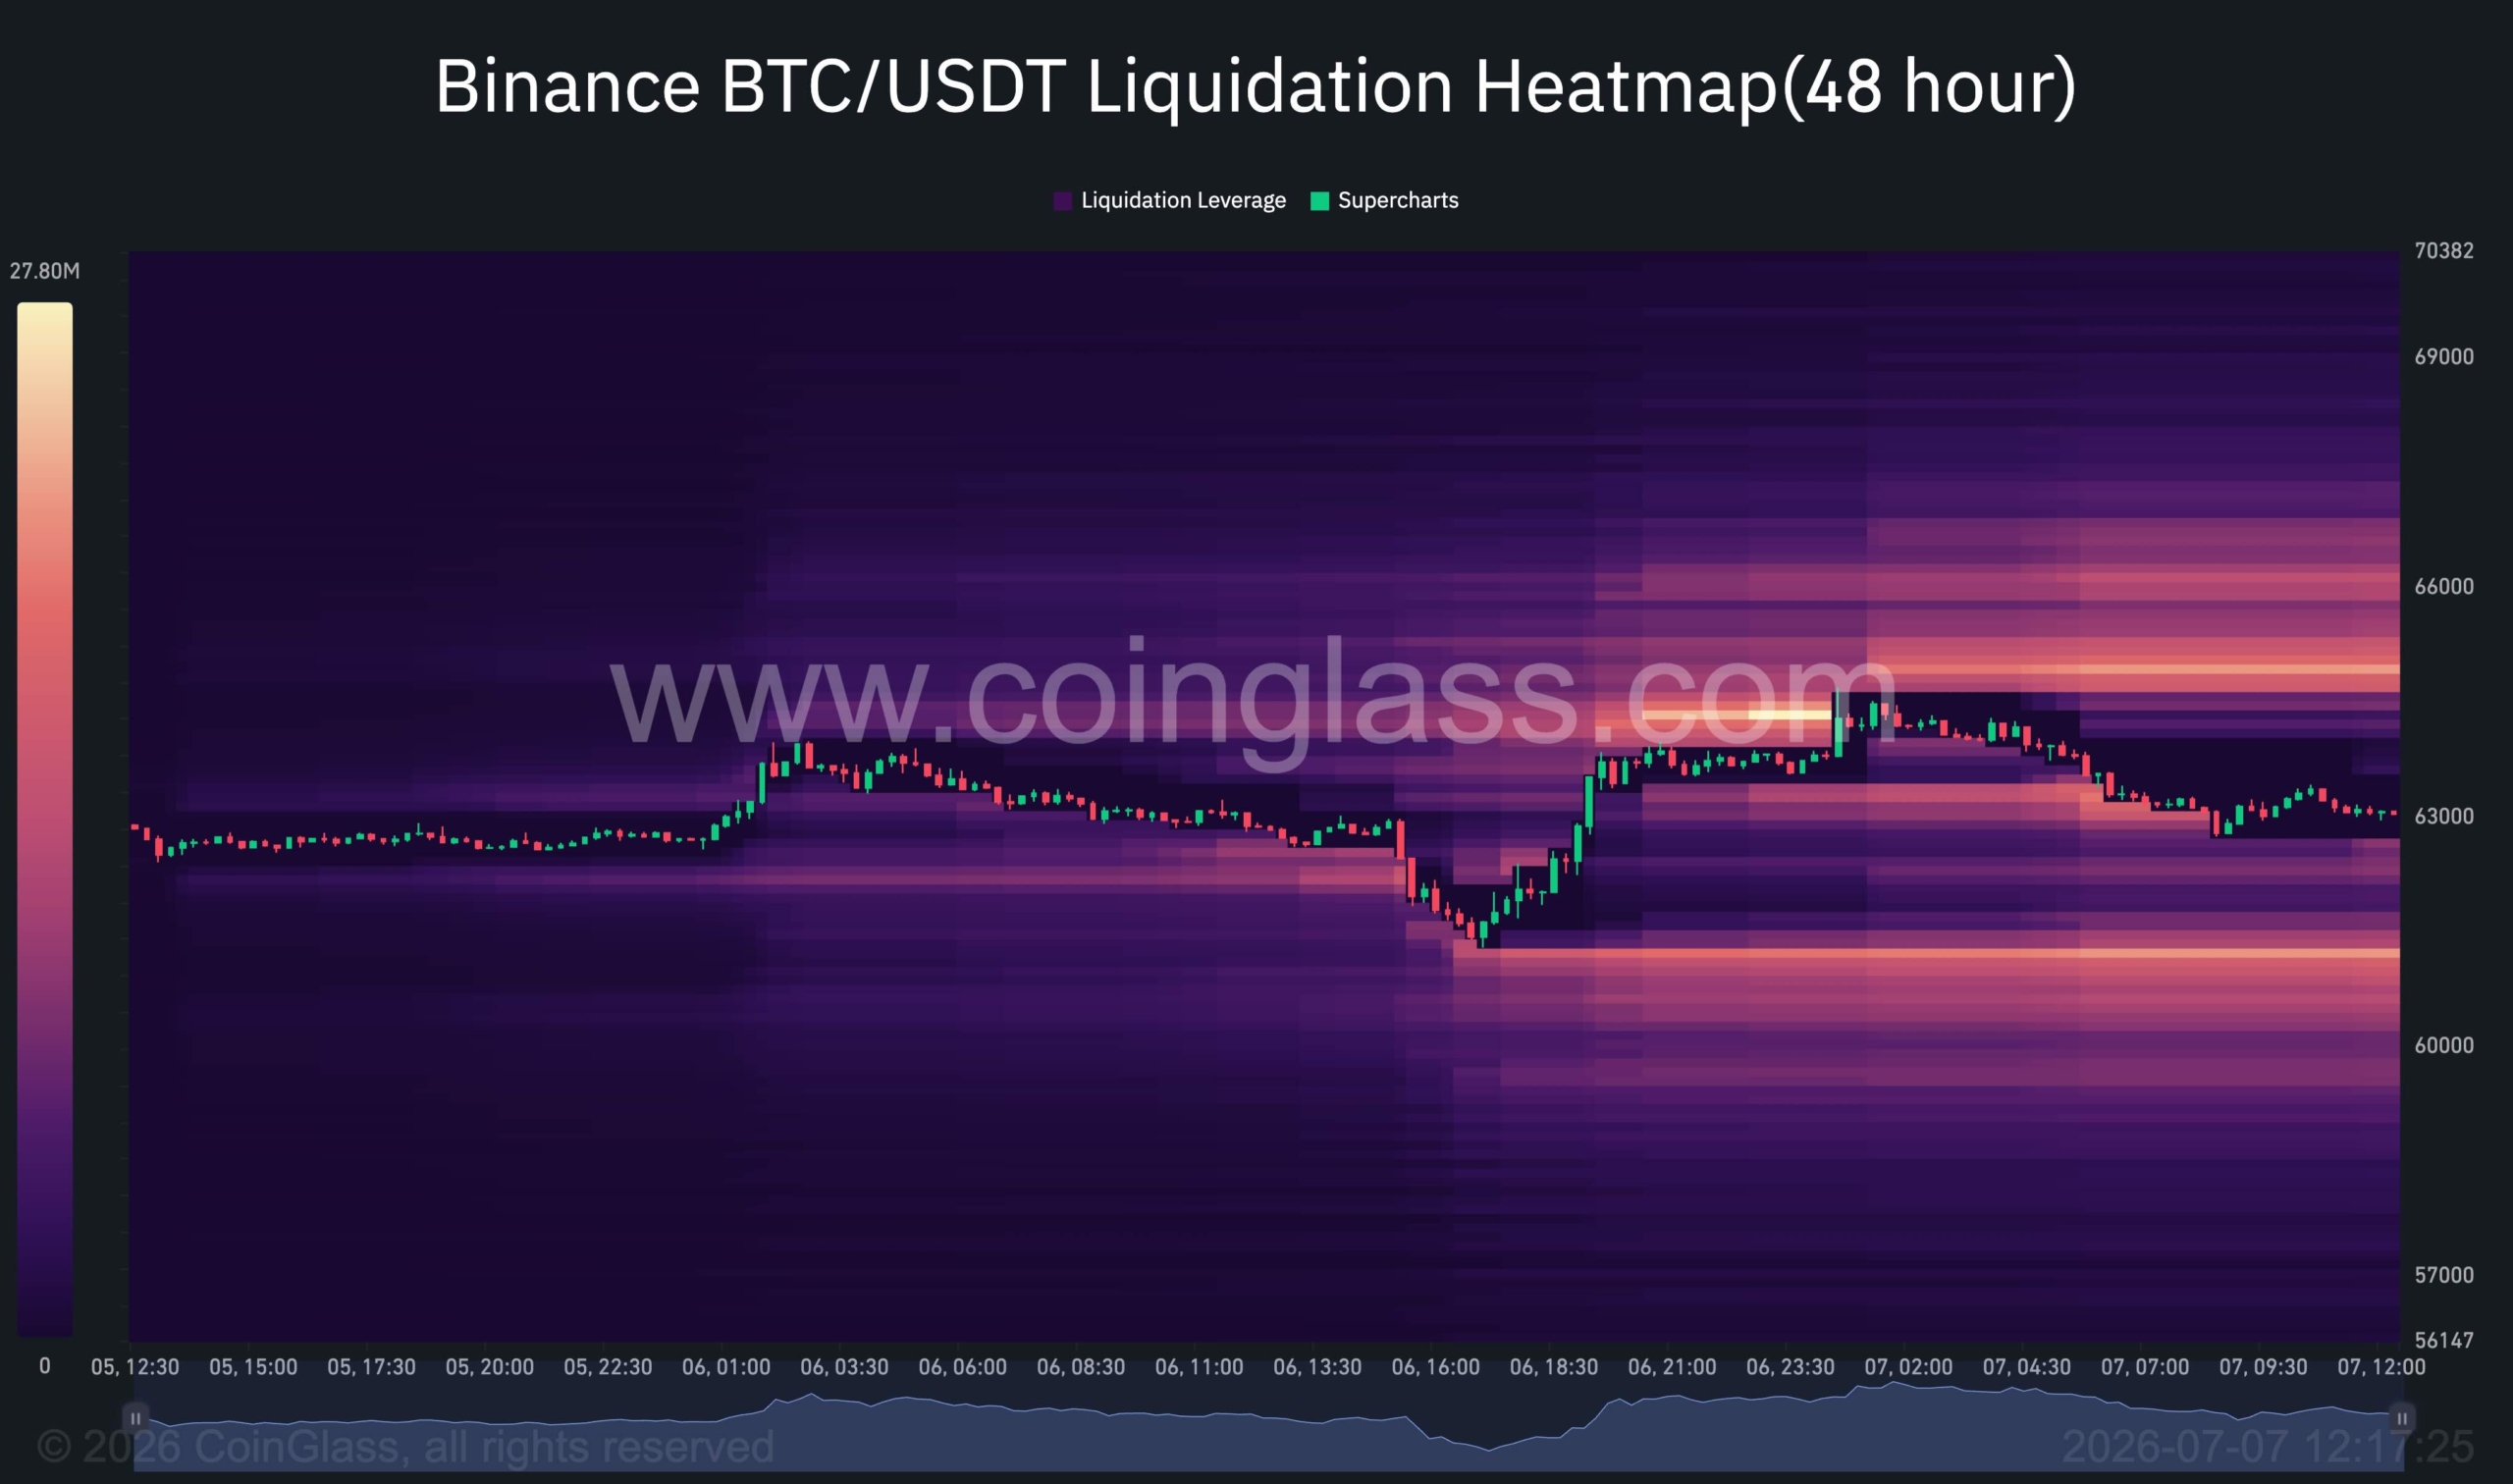
The 48-hour liquidation heatmap highlights a notable concentration of liquidity above the current market price, particularly around the $64K-$66K region. This cluster aligns closely with the resistance zone identified on the 4-hour chart, reinforcing its significance as a major magnet for price action.
Importantly, the intra-range liquidity highlighted on the technical chart is also confirmed by the liquidation heatmap. The recent push into the $61K-$62K area successfully targeted nearby liquidity resting within the range, validating the idea that price has been moving between liquidity pockets rather than trending directionally.
At present, the largest liquidation concentration remains overhead near $65K-$66K, making it a logical target if buyers maintain momentum. Markets often gravitate toward these liquidity pools before determining the next directional move.
If Bitcoin manages to sweep this overhead liquidity and secure acceptance above the $64K-$66K region, it would strengthen the case for a broader recovery toward the higher resistance zones. However, if the sweep is followed by rejection and an inability to sustain prices above resistance, the move could simply represent a liquidity-driven rally before another test of lower support levels.
For now, both the technical structure and the liquidation data suggest that the path of least resistance remains slightly higher, with the overhead liquidity cluster acting as the most likely near-term destination.
The post appeared first on CryptoPotato.
read the full story
Bitcoin continues to recover from its recent sell-off, but the market remains trapped beneath a major resistance cluster that has capped every relief rally since the June breakdown. While short-term momentum has improved, BTC is now approaching a decisive area where the next move could determine whether the recovery evolves into a larger trend reversal or remains a corrective bounce within a broader bearish structure.
Bitcoin Price Analysis: The Daily Chart
On the daily timeframe, Bitcoin remains in a clear downtrend, trading below the 100-day and 200-day moving averages, both of which continue to slope lower. The recent recovery from the $58K-$61K demand zone has helped stabilize the price action, but the asset is still trading beneath the major resistance area between $64K and $66.5K.
It recently formed another higher low inside the broader support region, while the RSI has continued to print higher lows despite the weakness seen throughout June. This developing bullish divergence suggests that downside momentum is fading and that buyers are gradually regaining control.
However, the market structure remains bearish until Bitcoin can reclaim the $64K-$66.5K supply zone. This area aligns with previous support turned resistance and continues to act as the primary obstacle preventing a larger recovery. A successful breakout above this region would likely expose the next major resistance near $72K-$74K, while rejection could send the price back toward the $60K support zone.
BTC/USDT 4-Hour Chart
The 4-hour chart shows a much more constructive picture. After establishing a base around the $58K-$59K demand region, Bitcoin produced a strong impulsive rally and pushed directly into the descending trendline that has defined the corrective structure since mid-June.
The asset recently swept the local liquidity resting above previous highs within the $61K-$62K region before encountering resistance near the descending trendline. This liquidity grab is important because it removed nearby buy-side liquidity and allowed the market to test a key technical level.
The current structure suggests that Bitcoin is attempting to transition from a series of lower highs into a potential breakout formation. A confirmed move above the descending trendline and the $64K-$66K resistance zone would significantly improve the bullish outlook and could accelerate upside momentum toward higher resistance levels.
Conversely, failure to break the trendline could trigger another period of consolidation between the $60K support and the $64K-$66K supply zone. As long as Bitcoin holds above the $60K-$61K support area, the short-term recovery structure remains intact.
Sentiment Analysis
The 48-hour liquidation heatmap highlights a notable concentration of liquidity above the current market price, particularly around the $64K-$66K region. This cluster aligns closely with the resistance zone identified on the 4-hour chart, reinforcing its significance as a major magnet for price action.
Importantly, the intra-range liquidity highlighted on the technical chart is also confirmed by the liquidation heatmap. The recent push into the $61K-$62K area successfully targeted nearby liquidity resting within the range, validating the idea that price has been moving between liquidity pockets rather than trending directionally.
At present, the largest liquidation concentration remains overhead near $65K-$66K, making it a logical target if buyers maintain momentum. Markets often gravitate toward these liquidity pools before determining the next directional move.
If Bitcoin manages to sweep this overhead liquidity and secure acceptance above the $64K-$66K region, it would strengthen the case for a broader recovery toward the higher resistance zones. However, if the sweep is followed by rejection and an inability to sustain prices above resistance, the move could simply represent a liquidity-driven rally before another test of lower support levels.
For now, both the technical structure and the liquidation data suggest that the path of least resistance remains slightly higher, with the overhead liquidity cluster acting as the most likely near-term destination.
The post appeared first on CryptoPotato.
read the full story
Binance Rolls Out New Bitcoin Yield Product to Help Holders Boost Returns Without Selling
TL;DR: Binance launched BTC Yield, a bitcoin yield product available within its Earn platform,…

Bitcoin dominance hits one-month low as altcoin winners start breaking away
Bitcoin's dominance dropped to a one-month low of 54%, down from 58.12%, according to CoinGecko's…


Bitcoin Hits $63,195 as $265M ETF Inflows Battle $81B Futures Dominance
What happened Bitcoin climbed to roughly $63,195 last week. That’s a 6.6% gain in seven days…

Former Tether investment chief is looking to sell part of his stake in the stablecoin giant: Bloomberg
Richard Heathcote is reportedly working with PJT Partners to find a buyer for a small part of his…

Hyperliquid Stays Near All-Time High, Even as Bitcoin ETFs Lose $6.5 Billion
Even as billions of dollars exit major crypto investment products, Hyperliquid’s HYPE token has…

Bitcoin’s $70K path now runs through pump prices as Iran shock fades
Bitcoin cleared $60,000 again the week the Bureau of Labor Statistics reported June payrolls grew by…
Has Bitcoin bottomed for this cycle? Analysts say 'not yet'
Some Bitcoin analysts point to a deeper downside risk, while others believes they can see the early…

Bitcoin nears cycle bottom as over half of supply is held at a loss, says K33
K33 said Bitcoin has historically bottomed within weeks of more than half of its circulating supply…
Bitcoin, XRP draw Japanese firms as weak yen drives treasury diversification
SBI VC Trade says corporate demand for crypto is rising as a weak yen pushes firms to diversify…
A Dangerous Threat Faces Bitcoin, XRP, ETH and SOL, Alphractal CEO Warns
Joao Wedson, founder and CEO of Alphractal, issued a sharp warning on July 7. His diagnosis is…

Why Japan’s Bond Market Could Kill the Easy-Money Rally in Stocks and Bitcoin
Japan bond market stress and record yen shorts threaten the cheap money rally powering stocks and…
U.S. Bitcoin Reserve Plan Hits Wall as 3 Agencies Fight Over Control
The plan for a national Bitcoin reserve is basically dead in the water right now. Federal agencies…
Strategy started selling Bitcoin. The never-sell era is over
Strategy sold 3,588 BTC at a loss to pay preferred dividends. Inside the $1.25B monetization program…

Bitcoin price stalls below $64K as Fed hopes meet oil risks and bearish divergence
Bitcoin has held above $63,000 after last week’s macro-driven rebound, but traders are now…
Grid Alerts Threaten Crypto: How 100-Degree Temps Impacted Bitcoin Mining
Triple-digit temperatures and soaring wholesale electricity prices reportedly squeezed U.S. bitcoin…
Bitcoin price rebounds to $63K as leverage returns creating short term volatility risk
BTC has recovered from last week's low, but ETF persistence, spot volume, and $61,000-$62,000…
Japanese Firms Accumulate More Bitcoin and XRP Amid Yen Drop, SBI Reports
SBI VC Trade tops 2 million accounts as a crashing yen triggers a massive corporate rush into…

Bitcoin Rebounds After Strategy’s Larger Sale Sparked Sudden Volatility
TL;DR: Bitcoin dropped to $61,200 after Strategy disposed of more than 3,500 BTC, but quickly…
Bitcoin and Ether ETFs Attract $286 Million as Blackrock Funds Spark Broad Recovery
Crypto ETF flows opened the new week on a stronger footing, with bitcoin ETFs adding $265.69 million…