Bitcoin Price Analysis: Is BTC Ready for Another Leg Higher Next Week?Bitcoin has staged a notable rebound after sweeping liquidity beneath the June lows, but the recovery is now approaching a critical resistance cluster. While momentum has improved in the short term, the broader structure remains bearish until BTC reclaims several major resistance levels overhead.
Bitcoin Price Analysis: The Daily Chart
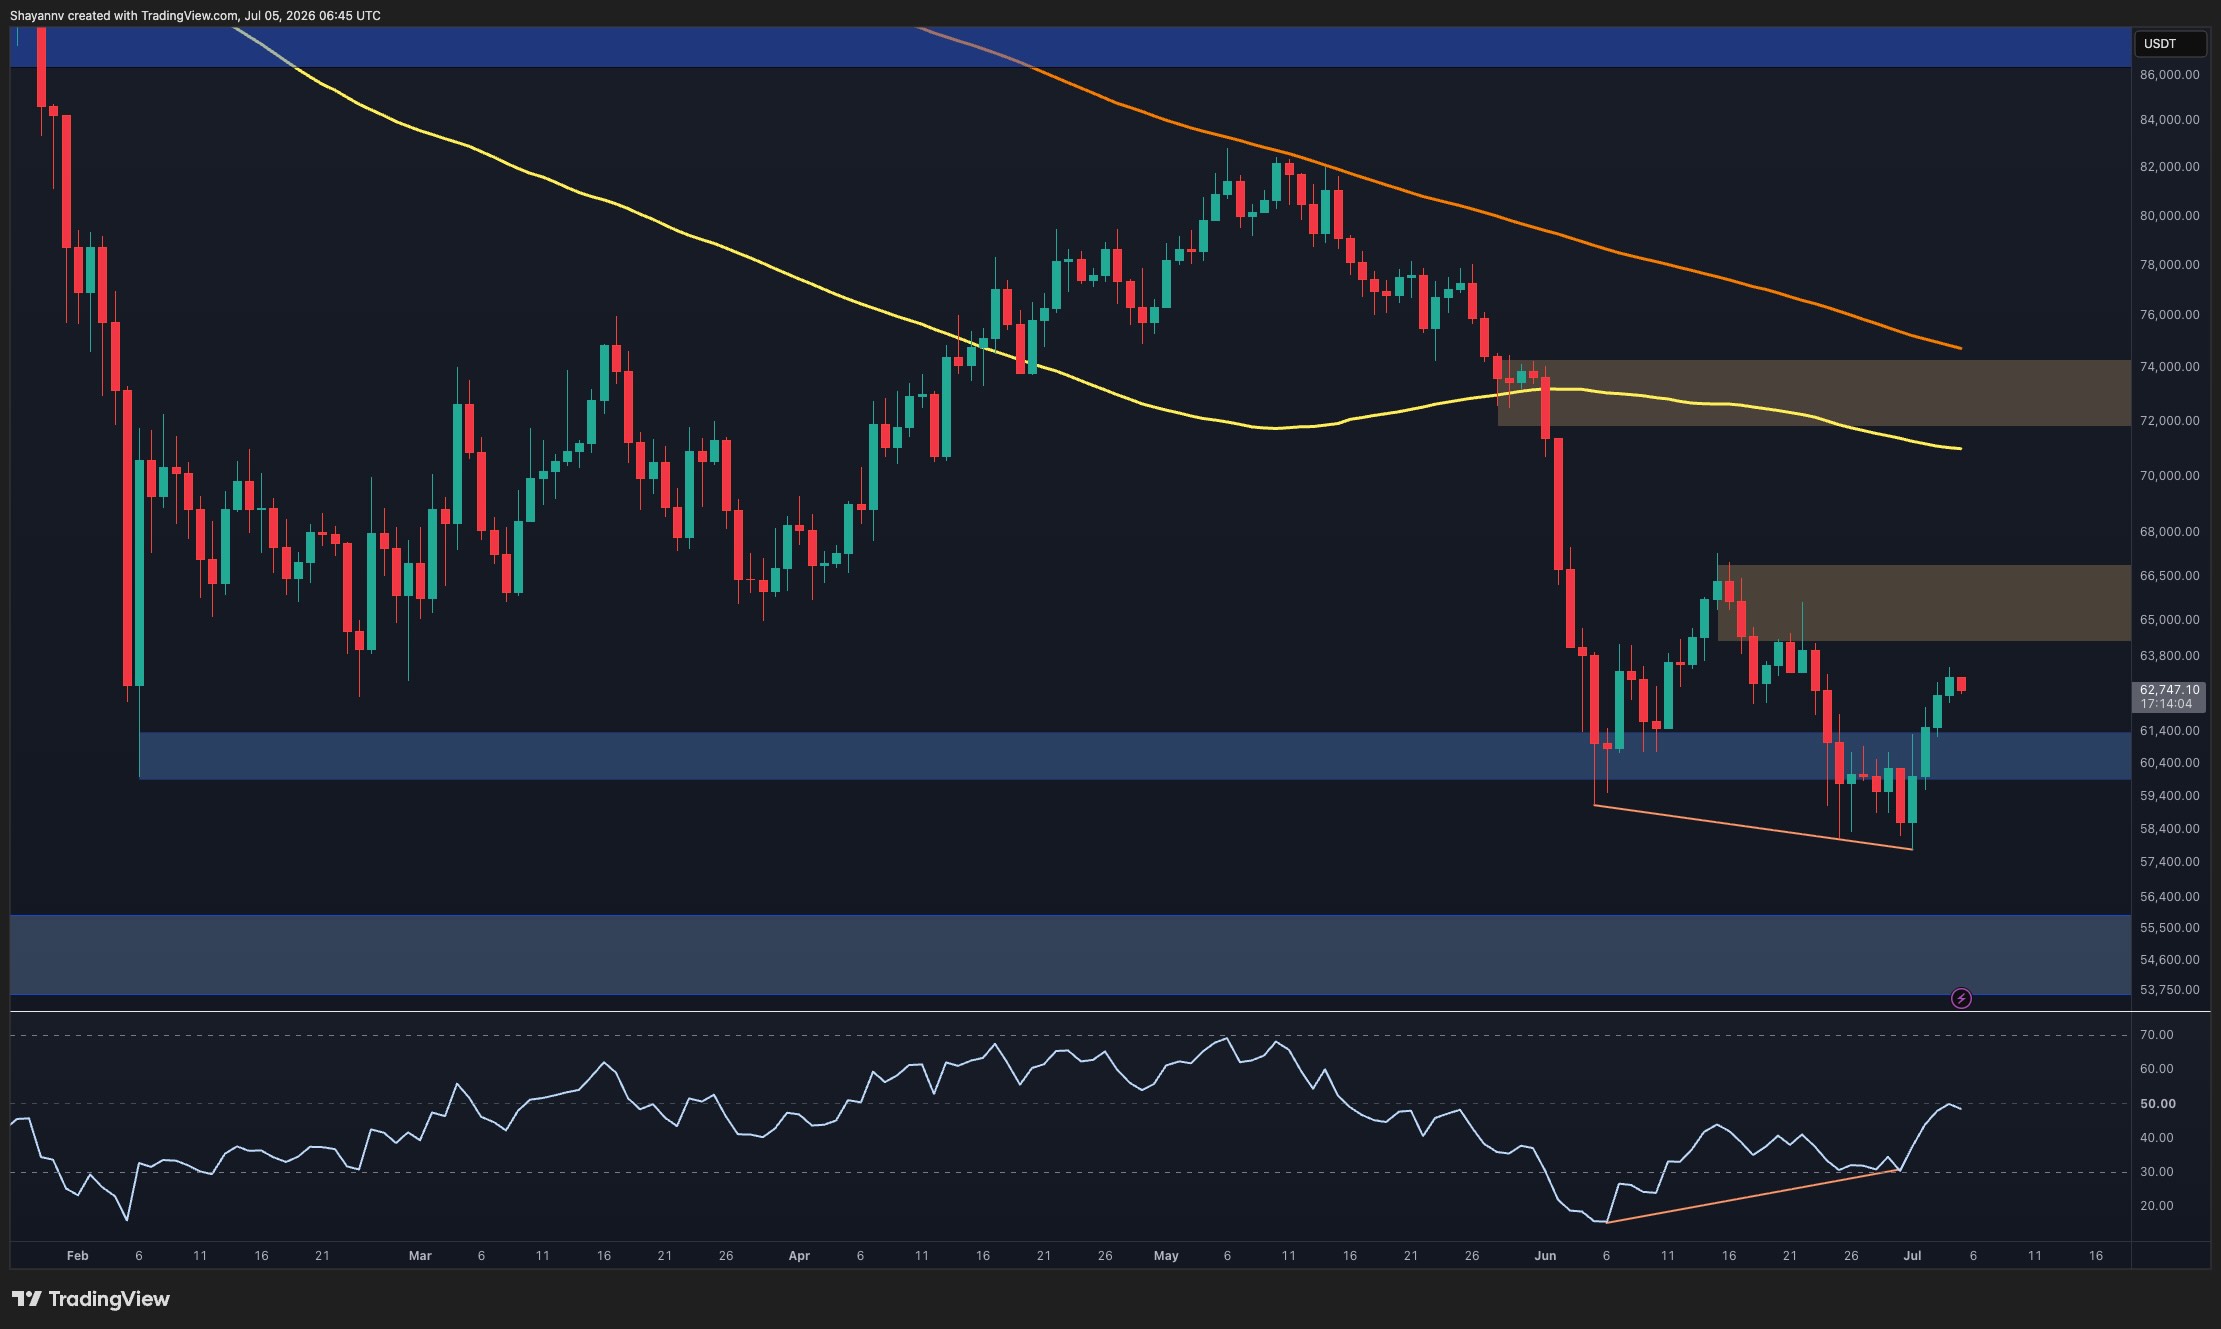
The daily timeframe shows Bitcoin continuing to trade below its key moving averages, with both the 100-day and 200-day moving averages sloping lower and acting as dynamic resistance. The market remains structurally bearish after losing the $72K-$74K support zone in June, which has now flipped into a major supply area.
However, the recent price action is becoming more constructive. BTC successfully defended the $58K-$61K support region and produced a sharp bounce from the lower boundary of the broader descending structure.
More importantly, the daily RSI has formed a bullish divergence, with momentum making higher lows while the price registered comparable or lower lows around the June bottom. This divergence often appears during exhaustion phases and suggests selling pressure has been weakening despite the downtrend.
The immediate challenge lies around $65K-$67K, where a major resistance zone intersects with the descending upper trendline. A successful breakout above this area would likely trigger a larger recovery toward the former breakdown region near $72K-$74K. Conversely, rejection from the current resistance cluster would reinforce the prevailing bearish structure and increase the probability of another move toward the $60K support area.
BTC/USDT 4-Hour Chart
The 4-hour chart highlights a developing falling wedge structure. Bitcoin recently rebounded from the lower boundary near $58K and has advanced steadily toward the upper trendline, which currently converges with the $63K-$64K area.
The recovery has already reclaimed the $60K-$61K support zone, turning it back into a short-term demand area. Price is now testing the upper boundary of the wedge while approaching the lower edge of the $64K-$66.5K supply zone.
A breakout above the descending trendline could accelerate bullish momentum and open the path toward the higher resistance region around $65K-$67K. Such a move would also confirm a short-term shift in market structure after weeks of lower highs.
If the breakout fails, Bitcoin may continue consolidating inside the wedge before attempting another push higher. The $60K-$61K region remains the most important near-term support, while a breakdown below it would place the recent recovery at risk.

Sentiment Analysis
The Spot Average Order Size metric provides insight into the behavior of larger market participants. Recent data shows that whale-sized transactions continue to dominate activity despite Bitcoin trading near local lows.
The latest readings indicate that large orders remain active in the market while prices hover around the $60K-$63K region. Although the metric alone cannot determine directional intent, the persistence of larger transaction sizes during a prolonged decline suggests institutional and high-net-worth participants remain engaged rather than stepping away from the market.
Combined with the bullish RSI divergence on the daily chart and Bitcoin’s defense of the $58K-$61K support zone, the data suggests accumulation interest may be emerging around current levels. Nevertheless, confirmation still requires a technical breakout above the descending trendline and the $65K-$67K resistance cluster.
Until that occurs, Bitcoin remains in a broader corrective structure, with the current recovery appearing more like an attempt to build a base rather than a confirmed trend reversal.

The post appeared first on CryptoPotato.
read the full story
Bitcoin has staged a notable rebound after sweeping liquidity beneath the June lows, but the recovery is now approaching a critical resistance cluster. While momentum has improved in the short term, the broader structure remains bearish until BTC reclaims several major resistance levels overhead.
Bitcoin Price Analysis: The Daily Chart
The daily timeframe shows Bitcoin continuing to trade below its key moving averages, with both the 100-day and 200-day moving averages sloping lower and acting as dynamic resistance. The market remains structurally bearish after losing the $72K-$74K support zone in June, which has now flipped into a major supply area.
However, the recent price action is becoming more constructive. BTC successfully defended the $58K-$61K support region and produced a sharp bounce from the lower boundary of the broader descending structure.
More importantly, the daily RSI has formed a bullish divergence, with momentum making higher lows while the price registered comparable or lower lows around the June bottom. This divergence often appears during exhaustion phases and suggests selling pressure has been weakening despite the downtrend.
The immediate challenge lies around $65K-$67K, where a major resistance zone intersects with the descending upper trendline. A successful breakout above this area would likely trigger a larger recovery toward the former breakdown region near $72K-$74K. Conversely, rejection from the current resistance cluster would reinforce the prevailing bearish structure and increase the probability of another move toward the $60K support area.
BTC/USDT 4-Hour Chart
The 4-hour chart highlights a developing falling wedge structure. Bitcoin recently rebounded from the lower boundary near $58K and has advanced steadily toward the upper trendline, which currently converges with the $63K-$64K area.
The recovery has already reclaimed the $60K-$61K support zone, turning it back into a short-term demand area. Price is now testing the upper boundary of the wedge while approaching the lower edge of the $64K-$66.5K supply zone.
A breakout above the descending trendline could accelerate bullish momentum and open the path toward the higher resistance region around $65K-$67K. Such a move would also confirm a short-term shift in market structure after weeks of lower highs.
If the breakout fails, Bitcoin may continue consolidating inside the wedge before attempting another push higher. The $60K-$61K region remains the most important near-term support, while a breakdown below it would place the recent recovery at risk.
Sentiment Analysis
The Spot Average Order Size metric provides insight into the behavior of larger market participants. Recent data shows that whale-sized transactions continue to dominate activity despite Bitcoin trading near local lows.
The latest readings indicate that large orders remain active in the market while prices hover around the $60K-$63K region. Although the metric alone cannot determine directional intent, the persistence of larger transaction sizes during a prolonged decline suggests institutional and high-net-worth participants remain engaged rather than stepping away from the market.
Combined with the bullish RSI divergence on the daily chart and Bitcoin’s defense of the $58K-$61K support zone, the data suggests accumulation interest may be emerging around current levels. Nevertheless, confirmation still requires a technical breakout above the descending trendline and the $65K-$67K resistance cluster.
Until that occurs, Bitcoin remains in a broader corrective structure, with the current recovery appearing more like an attempt to build a base rather than a confirmed trend reversal.
The post appeared first on CryptoPotato.
read the full storyStrategy Still Dominates Corporate Bitcoin, But Treasury Premiums Are Under Pressure
Strategy remains the largest public corporate Bitcoin holder, yet the market is now watching mNAV…

Bitcoin Options Turn Call-Heavy Before July 8 FOMC Minutes: Will BTC Break $63,000?
Bitcoin options turn call-heavy before the July 8 FOMC minutes as max pain sits at $63,000 and put…

Bitcoin ETF Outflows Hit Record High Amid Market Uncertainty
The numbers are in, and they are painful. Bitcoin ETFs are experiencing their longest streak of…
Bitcoin ETF Outflows Hit Record Highs as Fed Uncertainty Rattles Institutional Investors
Bitcoin ETFs are bleeding. Record outflows have hit the market, and nobody’s pretending…
Bitcoin nears $63.5K into weekly close as trader warns of 'terrible' Monday
Bitcoin reached its highest levels in nearly a fortnight over the weekend, but BTC price action…

K Wave’s Bitcoin Exit Shows Treasury Trade Is No Longer One-Way
K Wave Media has exited its Bitcoin position after a short-lived treasury push, highlighting the…
Peter Brandt Eyes Selling Bitcoin to Invest in Gold, and Here is Why
Veteran trader Peter Brandt is eyeing a move from Bitcoin into gold, citing a technical breakout in…
Dormant Bitcoin From 2011 Moves After 14 Years, Up Over 700,000%
One of Bitcoin's oldest wallets just moved after 14 Years.

Legendary Trader Considers Selling Bitcoin for Gold
Legendary commodities trader Peter Brandt has revealed he is contemplating a major portfolio…
Banks have stopped asking if stablecoins belong in finance, now they're considering how
Financial institutions are racing to become the secure gateways for stablecoins as digital asset…
CryptoQuant Flags Exchange Deposit Spike As Bitcoin Volatility Risk Builds
CryptoQuant says exchange deposit activity has climbed across Bitcoin, Ethereum, and altcoins, a…
Bitcoin Transactions per Day Rebound in 2026, Reaching Third-Busiest Day Ever
Bitcoin’s network processed 862,979 transactions on June 23, 2026, the third-highest single day…
'Nothing to Relate It To': Satoshi Nakamoto's 16-Year-Old Message Predicts Bitcoin's Current Status
Satoshi Nakamoto’s 16-year-old “incomparable” Bitcoin warning just proved true at $63,000.
Citi Cuts Bitcoin Target To $82,000 As ETF Demand Weakens
Citi has lowered its 12-month Bitcoin and Ether forecasts after resetting its ETF inflow…
Michael Saylor Says Bitcoin’s Four-Year Cycle Is Losing Power: What Matters More
Michael Saylor argues bitcoin’s four-year cycle is losing dominance as the crypto asset becomes…
Total Stablecoin Cap Falls $1.9 Billion This Week While Sky Dollar Leads the Slide
Tether lost $791 million this week, a single-token drop that accounted for 41% of the $1.9 billion…
Glassnode Says Bitcoin Accumulation Is Building Under The Surface
Glassnode’s latest on-chain work suggests patient buyers are still absorbing Bitcoin despite the…
Bitcoin ETFs Try To Stabilize After A Brutal Run Of Outflows
US spot Bitcoin ETFs have shown signs of renewed inflows, but the broader flow picture is still…
Analysts: Ethereum’s Worst Period Is Over – Is ETH About to Crush BTC?
ETH just flashed a major signal that has historically led to massive gains (especially against BTC).