Bitcoin Price Analysis: Quiet Market Shift Signals Major Recovery for BTCThings have been quietly shifting in Bitcoin’s market structure over the past two weeks. After spending the better part of Q1 2026 in a relentless grind lower, BTC is now trading around $75.2k, above the upper boundary of the descending channel and at the $75k–$80k key resistance band. The question is no longer whether a recovery is underway, but whether it has enough structural backing to become something more durable.
Bitcoin Price Analysis: The Daily Chart
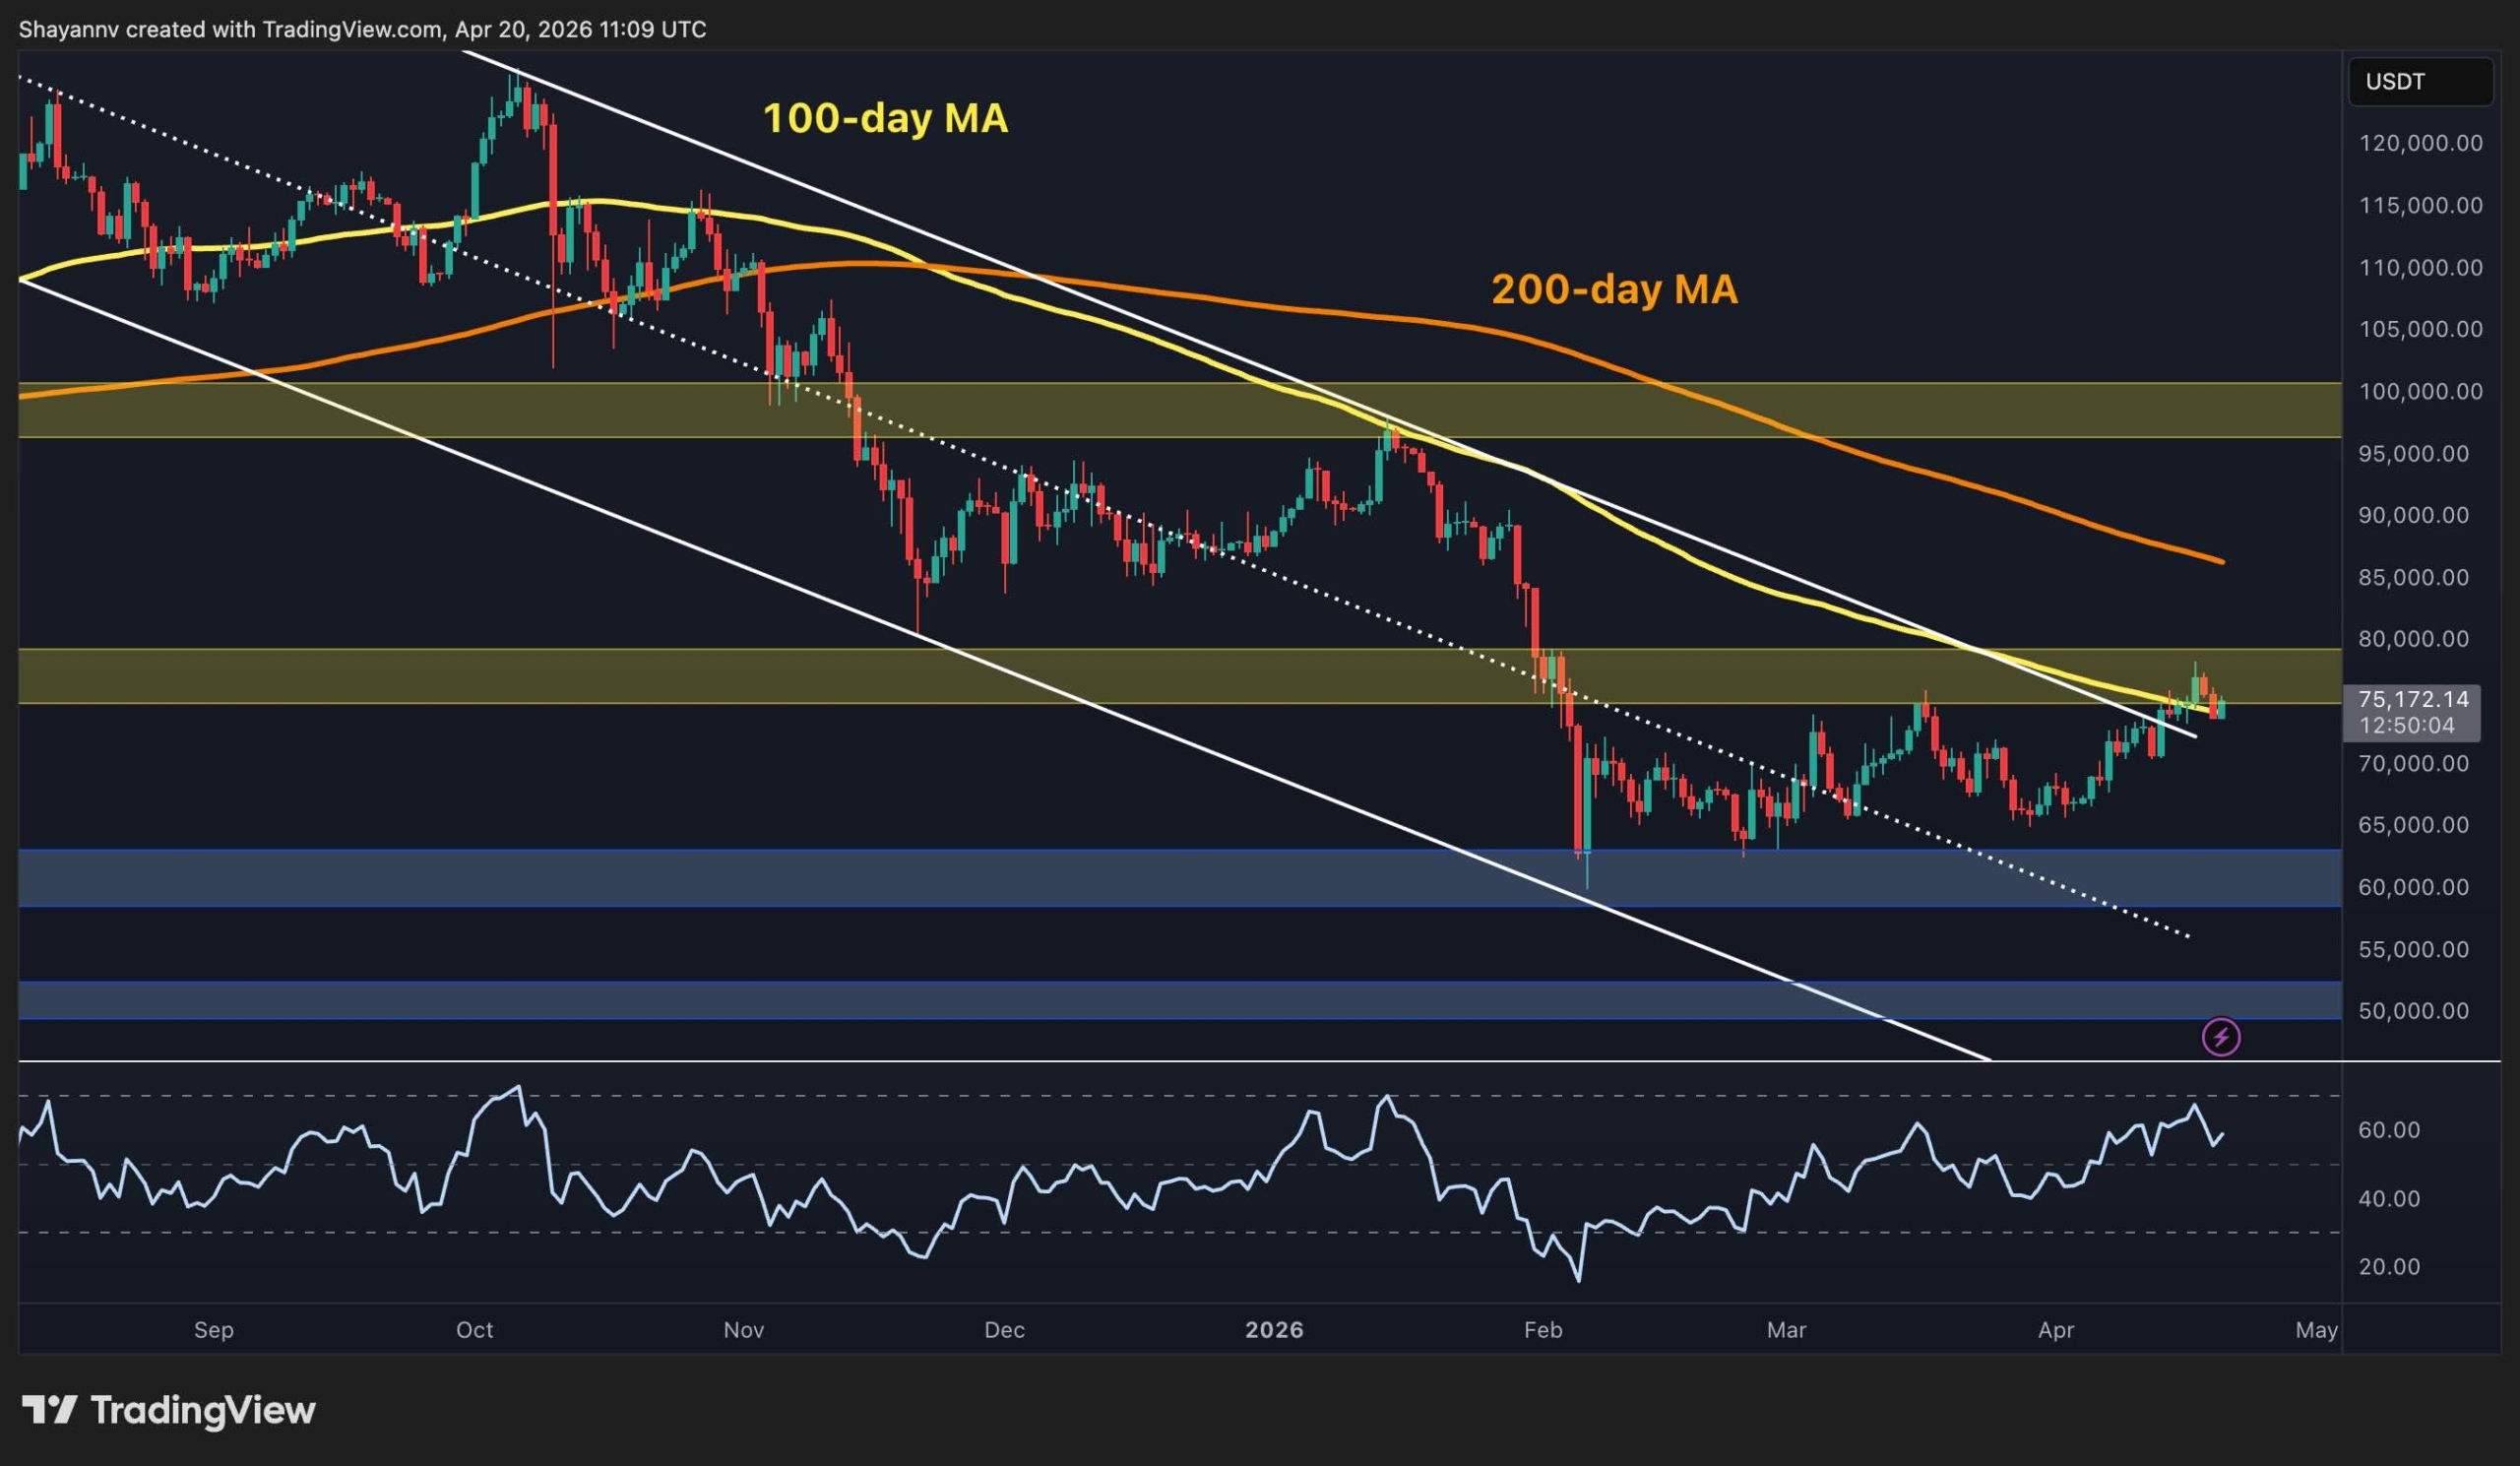
For months, every recovery attempt on the daily chart ran straight into the declining 100-day MA (currently located at ~$75k) and the descending channel’s upper boundary, and faded. The current attempt differs in one important respect: the RSI has been making higher lows since February and is far from overbought. This has built momentum beneath the price action, leading to a breakout above the 100-day MA and the channel’s upper boundary.
However, BTC is now sitting directly inside the $75k–$80k zone, and has yet to break above. Reclaiming this band on a closing basis, and more importantly, holding above it on a retest, would represent a genuine structural shift.
The 200-day MA (~$85k) and the $95k–$100k supply zone are the major hurdles above. The 100-day MA just below the current market price and the channel’s former upper boundary near $73k–$74k are now the first lines of support, with the $60k demand zone still remaining as the critical floor for this recovery.
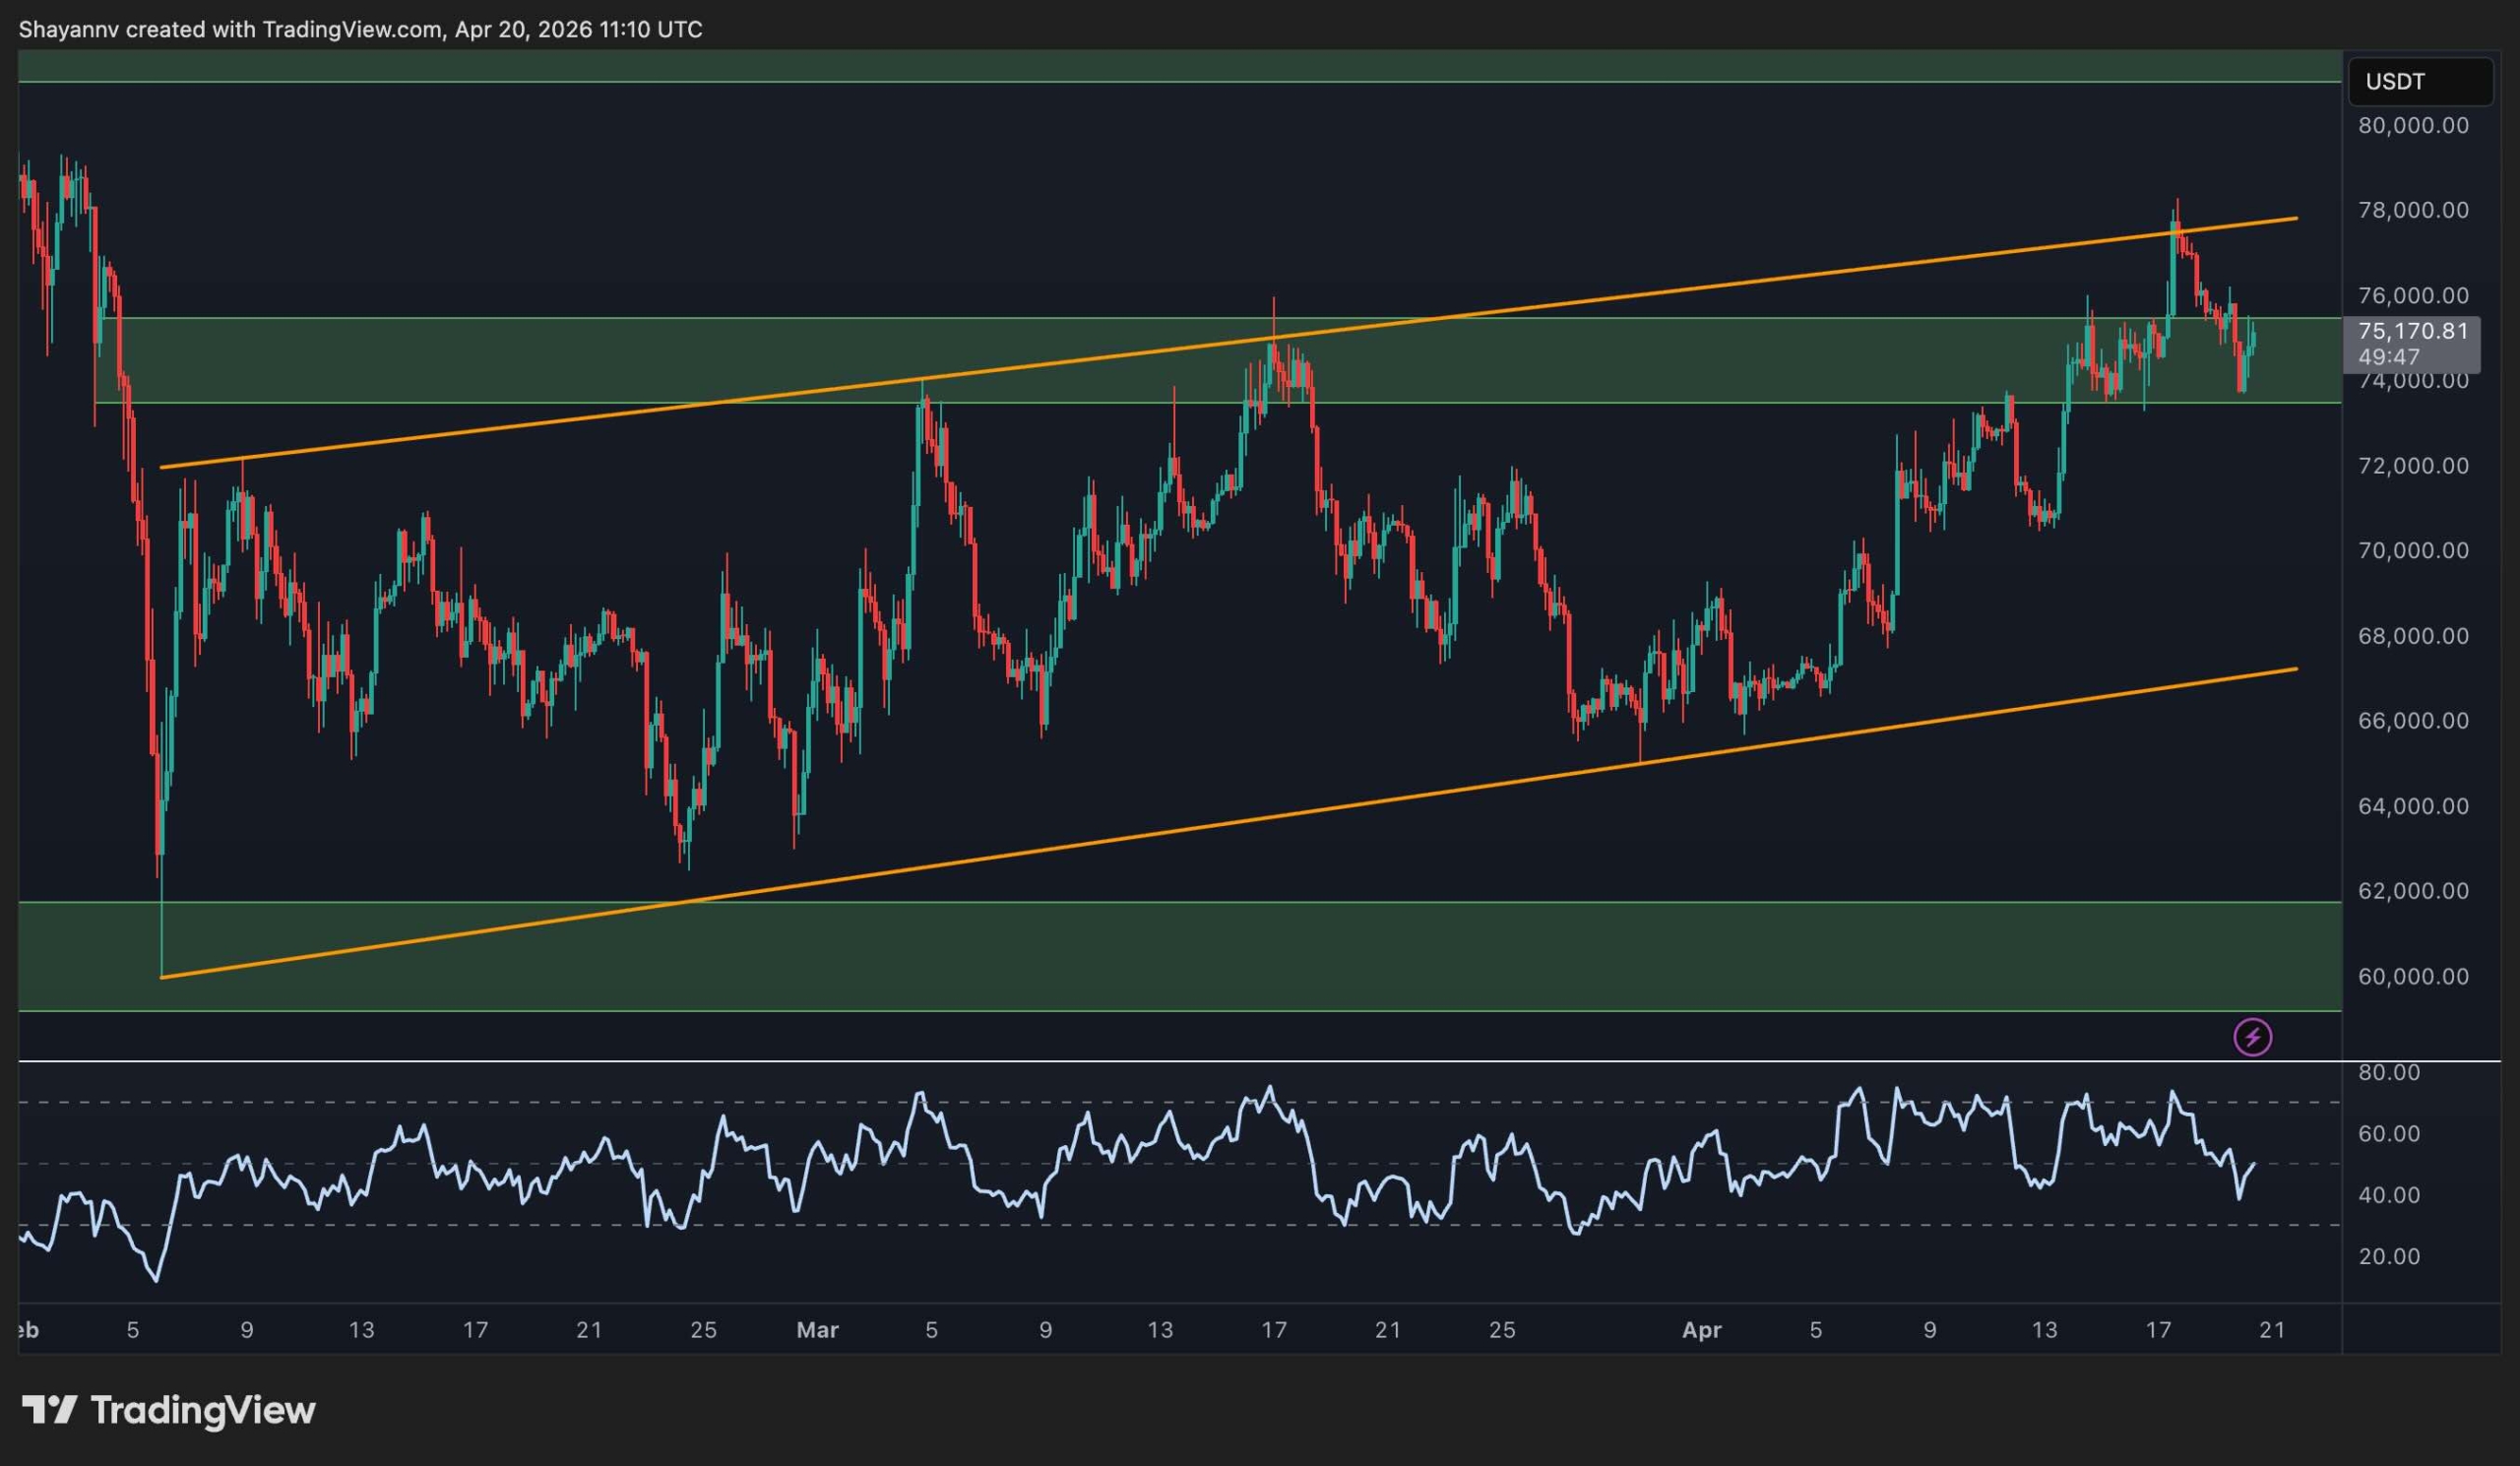
BTC/USDT 4-Hour Chart
The ascending channel from the February lows has done its job. It has been providing a rising structure of higher lows that gradually walked price from the $60k area all the way up to the channel’s upper boundary near $77k–$78k, which BTC tagged earlier this week before pulling back. The price is currently consolidating around $75.2k, sitting just inside the $74k–$76k resistance-turned-support level following the rejection.
The RSI on the 4-hour has also cooled from the high-70s during the push to around the 50s now, which points to a short-term cooling of momentum. This kind of pullback into a former resistance zone that has now flipped to support is textbook consolidation behavior, and the ascending channel’s lower boundary near $68k remains far enough below that the buyers have room to work with.
A reclaim of $76k with RSI holding above 55 would be the green light for another attempt at the upper channel boundary and beyond toward the $80k mark.
Sentiment Analysis
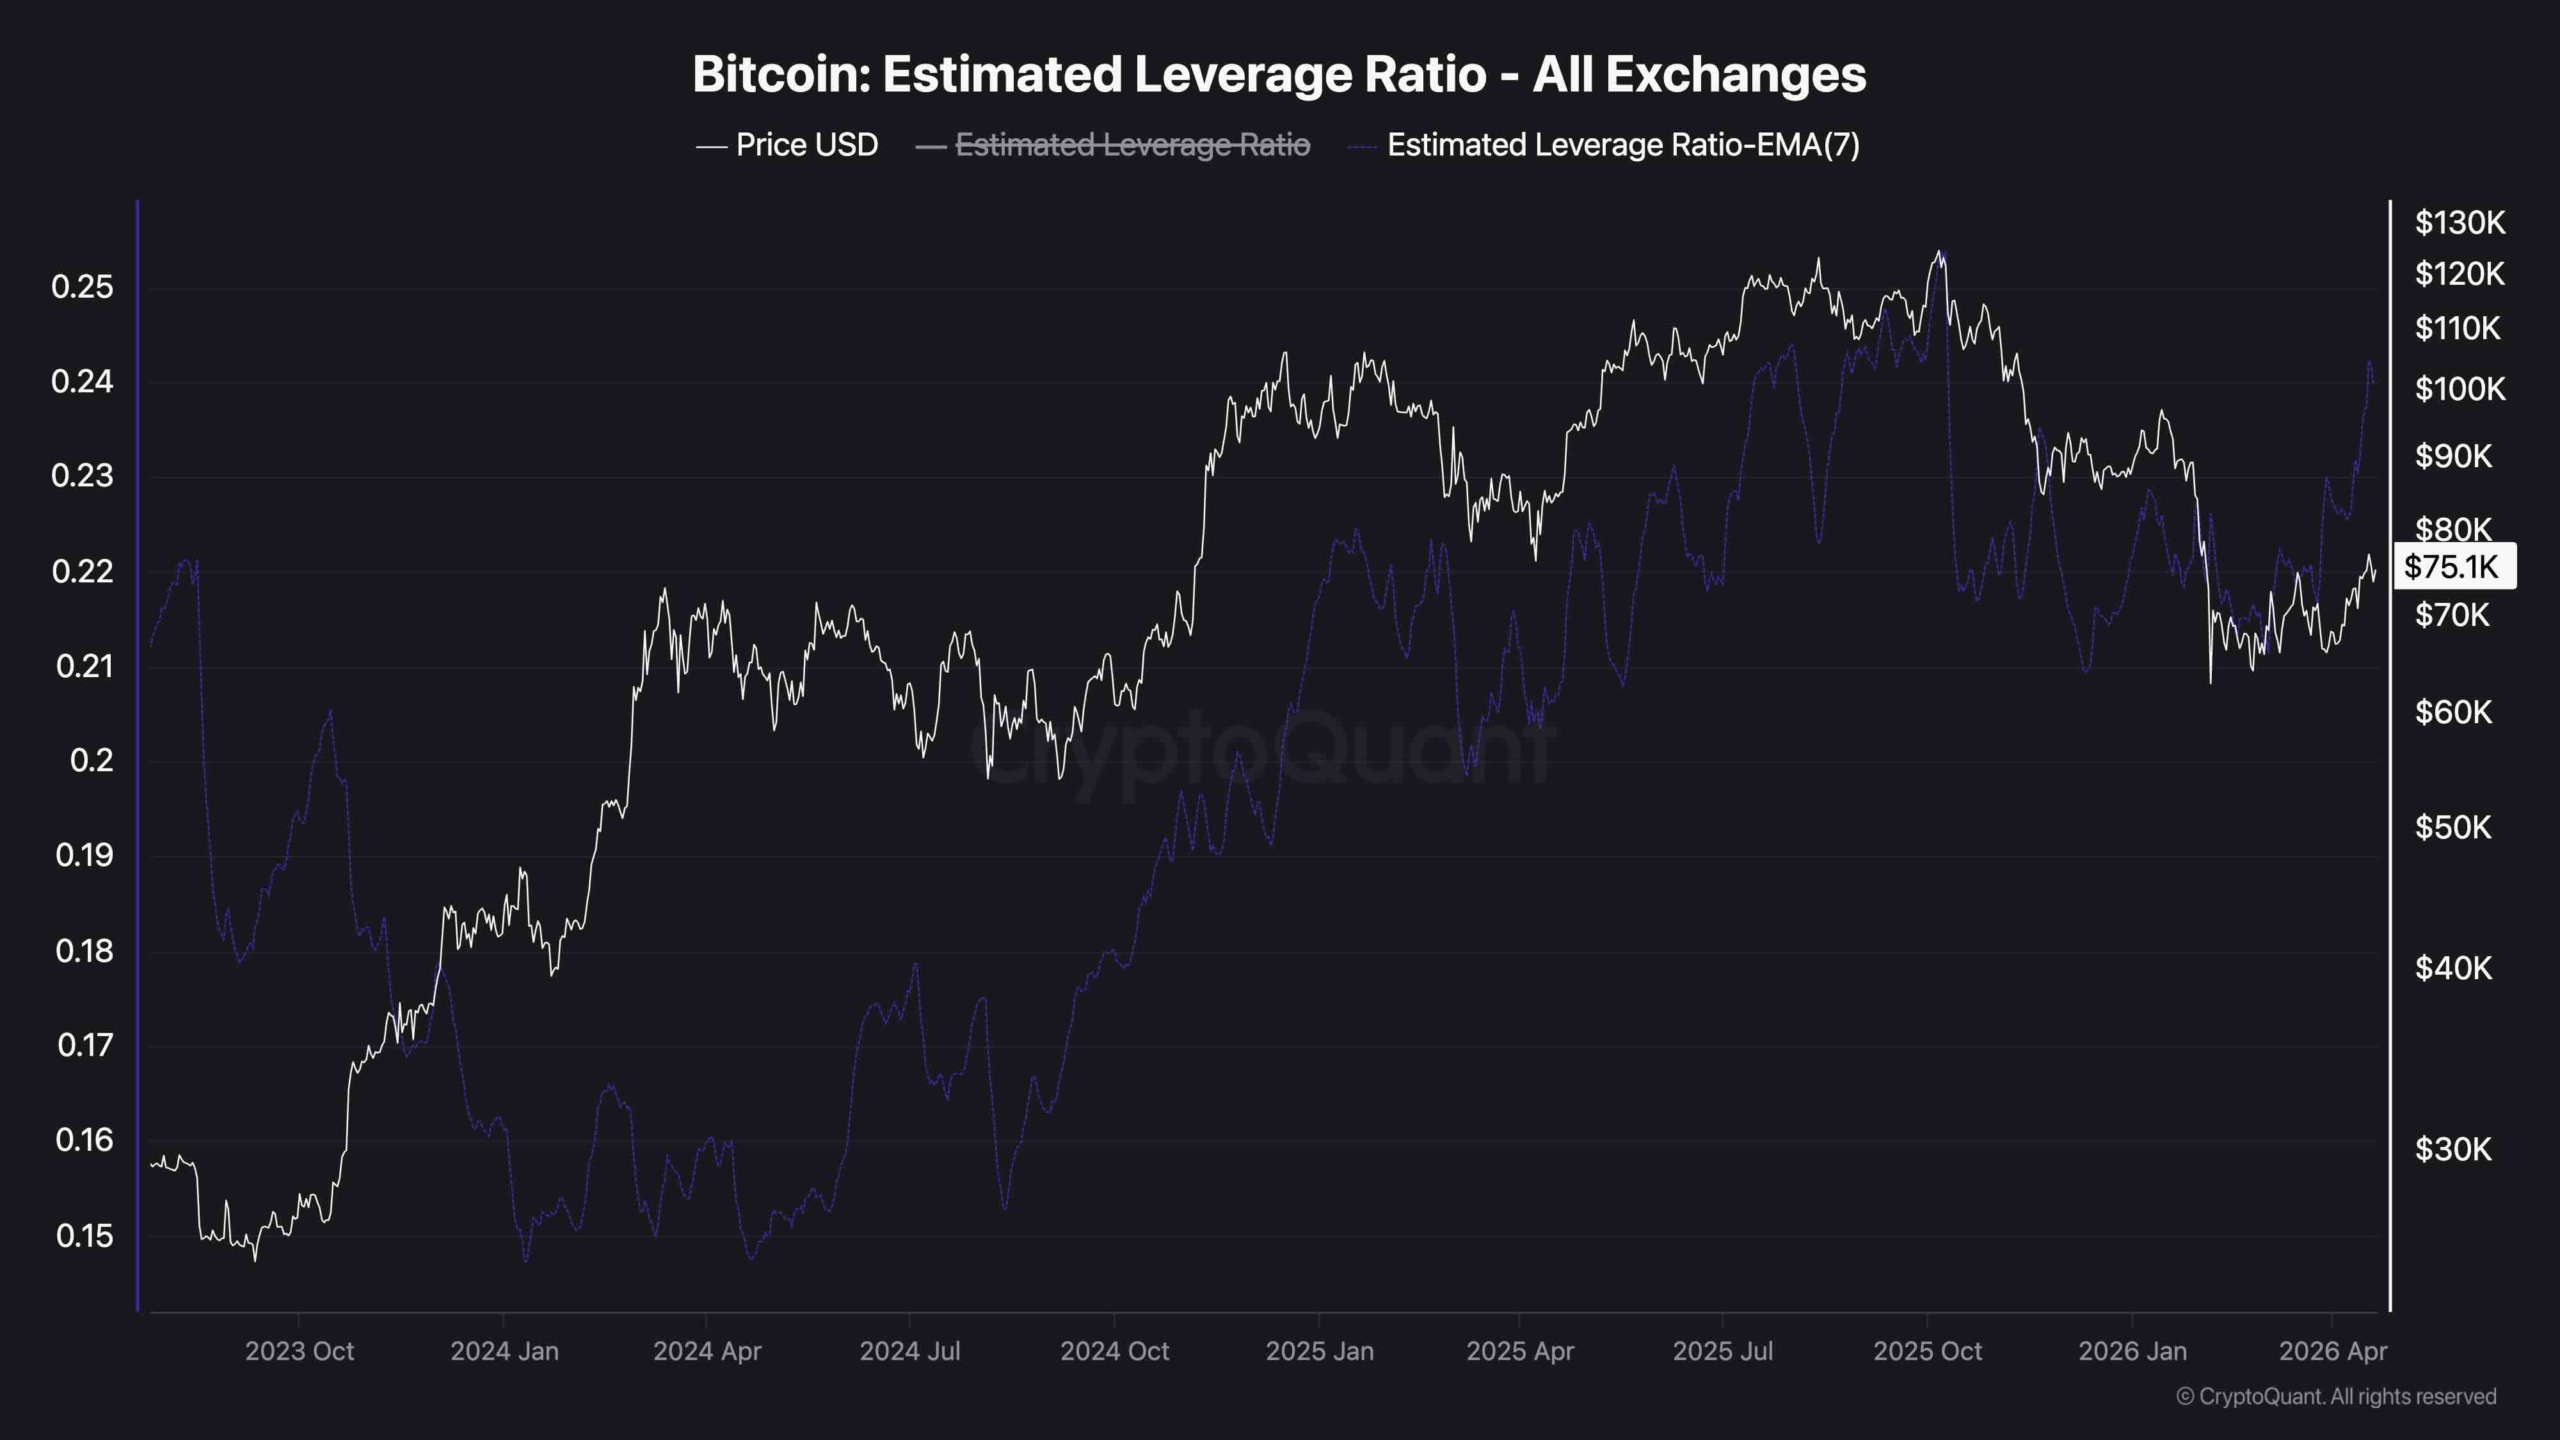
The Estimated Leverage Ratio across all exchanges has surged sharply in recent weeks, with the EMA(7) now pushing toward 0.24 and approaching the elevated levels last seen during the peak of the bull market in late 2025 when BTC was trading between $110k and $125k. This means traders are taking on significantly more leverage relative to the amount of BTC held on exchanges, at a price level that is still nearly 40% below those highs.
The interpretation here is nuanced. On one hand, rising leverage can fuel explosive upside moves if the breakout above $80k materializes, as a heavily leveraged long-side market in a short squeeze scenario is a powerful accelerant.
On the other hand, elevated leverage at a structurally uncertain level creates fragility. If BTC fails to hold the $75k support zone and rolls over, a cascade of liquidations could amplify any downside move significantly. Therefore, the decision time should close for Bitcoin, as to which direction it will accelerate in the coming weeks.
The post appeared first on CryptoPotato.
read the full story
Things have been quietly shifting in Bitcoin’s market structure over the past two weeks. After spending the better part of Q1 2026 in a relentless grind lower, BTC is now trading around $75.2k, above the upper boundary of the descending channel and at the $75k–$80k key resistance band. The question is no longer whether a recovery is underway, but whether it has enough structural backing to become something more durable.
Bitcoin Price Analysis: The Daily Chart
For months, every recovery attempt on the daily chart ran straight into the declining 100-day MA (currently located at ~$75k) and the descending channel’s upper boundary, and faded. The current attempt differs in one important respect: the RSI has been making higher lows since February and is far from overbought. This has built momentum beneath the price action, leading to a breakout above the 100-day MA and the channel’s upper boundary.
However, BTC is now sitting directly inside the $75k–$80k zone, and has yet to break above. Reclaiming this band on a closing basis, and more importantly, holding above it on a retest, would represent a genuine structural shift.
The 200-day MA (~$85k) and the $95k–$100k supply zone are the major hurdles above. The 100-day MA just below the current market price and the channel’s former upper boundary near $73k–$74k are now the first lines of support, with the $60k demand zone still remaining as the critical floor for this recovery.
BTC/USDT 4-Hour Chart
The ascending channel from the February lows has done its job. It has been providing a rising structure of higher lows that gradually walked price from the $60k area all the way up to the channel’s upper boundary near $77k–$78k, which BTC tagged earlier this week before pulling back. The price is currently consolidating around $75.2k, sitting just inside the $74k–$76k resistance-turned-support level following the rejection.
The RSI on the 4-hour has also cooled from the high-70s during the push to around the 50s now, which points to a short-term cooling of momentum. This kind of pullback into a former resistance zone that has now flipped to support is textbook consolidation behavior, and the ascending channel’s lower boundary near $68k remains far enough below that the buyers have room to work with.
A reclaim of $76k with RSI holding above 55 would be the green light for another attempt at the upper channel boundary and beyond toward the $80k mark.
Sentiment Analysis
The Estimated Leverage Ratio across all exchanges has surged sharply in recent weeks, with the EMA(7) now pushing toward 0.24 and approaching the elevated levels last seen during the peak of the bull market in late 2025 when BTC was trading between $110k and $125k. This means traders are taking on significantly more leverage relative to the amount of BTC held on exchanges, at a price level that is still nearly 40% below those highs.
The interpretation here is nuanced. On one hand, rising leverage can fuel explosive upside moves if the breakout above $80k materializes, as a heavily leveraged long-side market in a short squeeze scenario is a powerful accelerant.
On the other hand, elevated leverage at a structurally uncertain level creates fragility. If BTC fails to hold the $75k support zone and rolls over, a cascade of liquidations could amplify any downside move significantly. Therefore, the decision time should close for Bitcoin, as to which direction it will accelerate in the coming weeks.
The post appeared first on CryptoPotato.
read the full storyAdam Back Challenges the Biggest Claim About Satoshi’s Bitcoin Holdings
Adam Back, inventor of Hashcash and a pioneering figure in Bitcoin’s early development, has…

‘The Whole World Is a Casino’ – Bitcoin Rallies Again, and so Does Belief – Week in Review
This editorial is from last week’s edition of the newsletter Week in Review. Subscribe to the…
Metaplanet Scores $50M in Zero-Interest Bonds to Stack More BTC
Metaplanet just closed another bond sale. Fifty million dollars. Zero interest. The Japanese firm…
Reasons why Bitcoin may outperform Ethereum in Q2 for first time since 2023
Rising liquidity is strengthening BTC’s Q2 momentum against ETH.
Peter Schiff Warns of a “Death Spiral” in MicroStrategy’s Bitcoin Strategy
Peter Schiff is warning that MicroStrategy’s Bitcoin-backed yield strategy is heading toward a…
Pi Network’s PI Token Stages Notable Recovery as BTC Taps $78K: Weekend Watch
STABLE is today's top performer but PI follows suit closely.
Bitcoin price prediction – Here’s what’s limiting BTC’s breakout potential on the charts
Should you be betting on a decisive long-term trend shift?
Bitcoin Sees Rising Inflows Despite Bearish Positioning — Impact On Price
Crypto education page XWIN Research Japan has revealed an ongoing divergence between Bitcoin spot…

Bitcoin Reclaims Key MVRV Support At $73.7K — What Comes Next?
Bitcoin (BTC) has staged a notable recovery in April, rebounding from around $67,000 to as high as…
US Bitcoin ETFs are on their longest inflow streak this year as funds hit near 7% of BTC supply
Demand for US-listed spot Bitcoin ETFs has rebounded into its longest positive stretch of 2026,…
Central Bank of Brazil: Stablecoins Dominate Over $6.9 Billion Crypto Purchases Registered in Q1
According to data released by the Central Bank of Brazil, stablecoin purchases comprised $6.8…
Bitcoin Price Reacts After Trump Evacuated Following White House Gunshots
Binance's CZ also weighed in on the matter, saying it was "sickening" to see another attempt on…
Bitcoin Stalls At $77K As Major On-Chain Resistance Kicks In – Details
Bitcoin prices are consolidating around the $77,000 mark, following a net 2.12% in the last week.…
Shark Tank Kevin O’Leary Now Says Forget Alts, Hold Bitcoin, Ethereum
“Shark Tank” judge and business magnate Kevin O'Leary says he only recommends owning Bitcoin and…
Olenox Announces Merge With CS Digital to Develop Low Cost, Off-Grid Bitcoin Mining Opportunities
The two companies would agree to merge, with CS Digital receiving $55 million in an all-share…
Tether Conducts Biggest USDT Freeze Ever, Grayscale Makes Case for Bitcoin Bottom, And More – Week In Review
Europe’s MiCA rules helped euro stablecoins surge even as broader crypto adoption cooled, while a…
Bitcoin Price Wave Down To $40,000 Shows When The Bottom Will Begin
According to a crypto analyst, the Bitcoin price remains firmly in a bear trend and could be…
Ripple Says Multi-Asset Stablecoin Rails Are Becoming Critical for Global Payments
Stablecoin payments are moving rapidly into multi-asset infrastructure as volumes climb across…
Bitcoin Setup Suggests Liquidity Hunt Before Next Directional Move
Bitcoin is currently showing a structure that often precedes sharp volatility, with liquidity…